What is a Pivot Point and why should investors focus on them ?
A Pivot Point resides near the top of a trading range as a stock is developing a Handle. The proper time to buy a stock is when it begins to break above its Pivot Point and is accompanied by increasing volume.
Here are some Examples
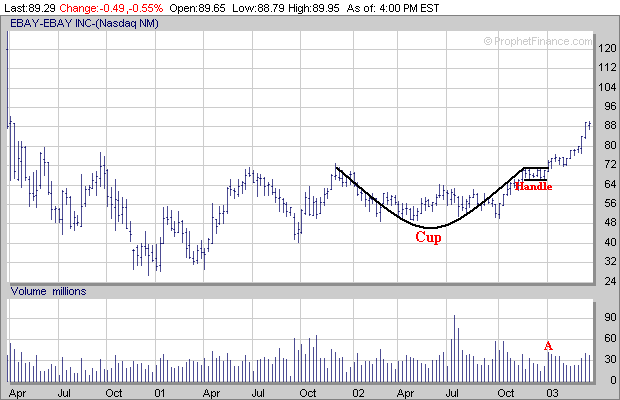
EBAY formed a 1 year Cup and then developed a 6 week Handle with a trading range between $65 and $71. The top of the trading range was near $71 which acted as the Pivot Point for EBAY. EBAY eventually broke above its Pivot Point in early January accompanied by an in increase in volume (point A).

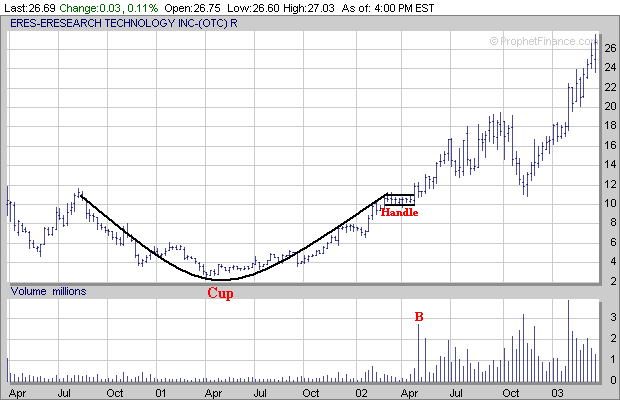
Another example is shown by ERES which formed a 1 1/2 year Cup followed by the development of an 8 week Handle with a trading range between $10 and $11. In this case the top of the trading range was near $11 which served as the Pivot Point. ERES broke above its Pivot Point in April of 2002 accompanied by very strong volume (point B).

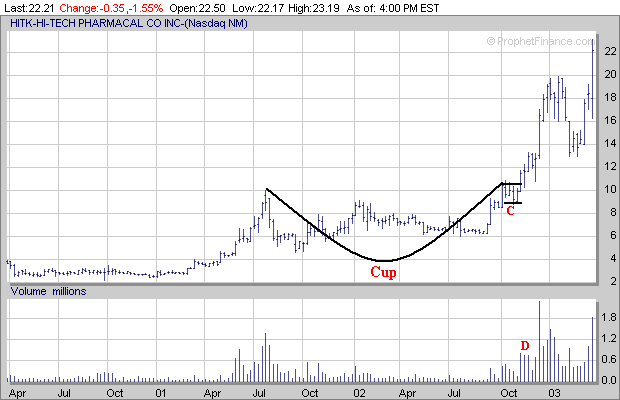
Another example is of HITK which formed a 1 1/2 year Cup followed by a 5 week Handle (point C) with a trading range between $9 and $11. In this example the top of the trading range was near $11 which served as the Pivot Point. HITK eventually broke above its Pivot Point in November of 2002 accompanied by an increasing in volume as well (point D).

As you can see the best time to purchase a stock is when it begins to break out of a favorable chart pattern such as the "Cup and Handle" and above its Pivot Point accompanied by increasing volume.


