


In the report you'll learn how to:
- Recognize profitable stock patterns
- Minimize your investment risk in three simple steps
- Lock in high returns by choosing the right selling price
- Maximize your profits even when the market is down
Profitable Pattern Number One
The Symmetrical Triangle: A Reliable Workhorse
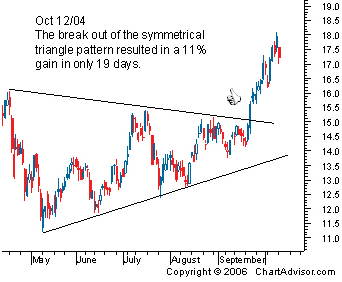
You’ll recognize the symmetrical triangle pattern when you see a stock’s price vacillating up and down and converging towards a single point. Its back and forth oscillations will become smaller and smaller until the stock reaches a critical price, breaks out of the pattern, and moves drastically up or down.
The symmetrical triangle pattern is formed when investors are unsure of a stock’s value. Once the pattern is broken, investors jump on the bandwagon, shooting the stock price north or south.
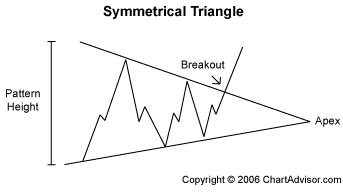 |
| Symmetrical Triangle Pattern To form your symmetrical triangle pattern, draw two converging trendlines that bound the high and low prices. Your trendlines should form (you guessed it) a symmetrical triangle, lying on its side. |
How to Profit from Symmetrical Triangles
Symmetrical triangles are very reliable. You can profit from upwards or downwards breakouts. You’ll learn more about how to earn from downtrends when we talk about maximizing profits.
If you see a symmetrical triangle forming, watch it closely. The sooner you catch the breakout, the more money you stand to make.
Watch For:
• Price of the asset traveling between two converging trendlines.
• Breakout ¾ of the way to the apex.
Set Your Target Price:
As with all patterns, knowing when to get out is as important as knowing when to get in. Your target price is the safest time to sell, even if it looks like the trend may be continuing.
For symmetrical triangles, sell your stock at a target price of:
• Entry price minus the pattern’s height for a downward breakout.
Profitable Pattern Number Two
Ascending and Descending Triangles: The Traditional Bull and Bear
When you notice a stock has a series of increasing troughs and the price is unable to break through a price barrier, chances are you are witnessing the birth of an ascending triangle pattern.
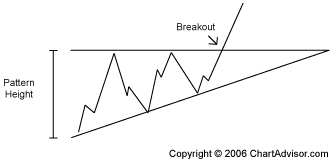 |
| Ascending Triangle Pattern Confirm your ascending triangle pattern by drawing a horizontal line tracing the upper price barrier and a diagonal line tracing the series of ascending troughs. |
The descending triangle is the bearish counterpart to the ascending triangle.
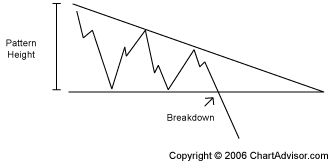 |
| Descending Triangle Pattern Confirm your descending triangle by drawing a horizontal line tracing the lower price barrier and a diagonal line tracing the series of descending troughs. |
The ascending and descending patterns indicate a stock is increasing or decreasing in demand. The stock meets a level of support or resistance (the horizontal trendline) several times before breaking out and continuing in the direction of the developing up or down pattern.
How to Profit from Ascending and Descending Triangles
Ascending and descending triangles are short-term investor favorites, because the trends allow short-term traders to earn from the same sharp price increase that long-term investors have been waiting for. Rather than holding on to a stock for months or years before you finally see a big payday, you can buy and hold for only a period of days and reap in the same monster returns as the long-time stock owners.
As with many of our favorite patterns, when you learn to identify ascending and descending triangles, you can profit from upwards or downwards breakouts. That way, you’ll earn a healthy profit regardless of where the market is going.
Watch For:
• An ascending or descending pattern forming over three to four weeks.
Set Your Target Price:
For ascending and descending triangles, sell your stock at a target price of:
• Entry price plus the pattern’s height for an upward breakout.
• Entry price minus the pattern’s height for a downward breakout.
Profitable Pattern Number Three
Head and Shoulders: A ChartAdvisor Staple
The head and shoulders pattern is a prevailing pattern among short sellers, investors who profit from downtrends. After three peaks, the stock plummets, offering a textbook, high-return opportunity to traders who catch the trend early.
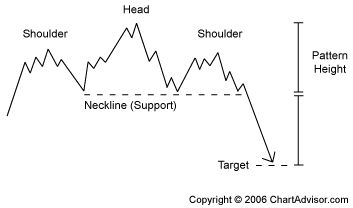 |
| Head and Shoulders Pattern Head and shoulder patterns are characterized by a large peak bordered on either side by two smaller peaks. Draw one trendline, called the neckline, connecting the bottom of the two troughs. |
The first trough is a signal that buying demand is starting to weaken. Investors who believe the stock is undervalued respond with a buying frenzy, followed by a flood of selling when traders fear the stock has run too high. This decline is followed by another buying streak which fizzles out early. Finally, the stock declines to its true worth below the original price.
How to Profit from the Head and Shoulders Pattern
• Short sell as soon as the price moves below the neckline after the descent from the right shoulder.
Set Your Target Price:
For the head and shoulders pattern, buy shares at a target price of:
• Entry price minus the pattern’s height (distance from the top of the head to the neckline).
Profitable Patterns Number Four and Five
Triple and Double Bottoms and Tops: Reversals upon reversals
When you see a W or M pattern forming, you may have just discovered a money-making double bottom or double top pattern. These patterns are common reversal patterns used to suggest the current stock trend may be likely to shift.
But don’t panic if your double bottom or double top patterns do not develop as you had originally thought. You haven’t lost your chance for cash. If your W or M pattern reverses for a fourth time, you could now be working with the profitable triple bottom or triple top.
Double Bottom Pattern
 |
| Double Bottom Pattern A small peak is surrounded by two equal troughs. |
Purchase When:
• The price exceeds the middle-peak price.
Watch For:
• A price increase of 10% to 20% from the first trough to the middle peak.• Two equal lows, not to differ by more than 3% or 4%.
Set Your Target Price:
For the double bottom pattern, sell your stock at a target price of:
• Entry price plus the pattern’s height (distance from the peak to the bottom of the lowest trough).
Double Top Pattern
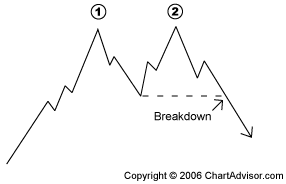 |
| Double Top Pattern A small trough is surrounded by two equal peaks. |
Short Sell When:
• The price drops below the middle-trough price.
Watch For:
• A price decrease of 10% to 20% from the first peak to the middle trough.
• Two equal highs, not to differ by more than 3% or 4%.
Set Your Target Price:
For the double top pattern, buy shares at a target price of:
• Entry price minus the pattern’s height (distance from the trough to the top of the highest peak).
Triple Bottom Pattern
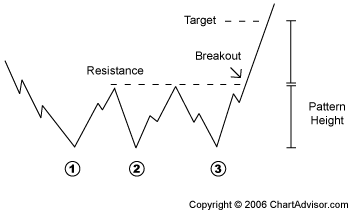 |
| Triple Bottom Pattern Three equal troughs amid a series of peaks. |
Purchase When:
Watch For:
• A series of three identical troughs at the end of a prolonged downtrend.
Set Your Target Price:
For triple bottom patterns, sell your stock at a target price of:
• Entry price plus the pattern’s height (distance from the resistance to the bottom of the lowest trough).
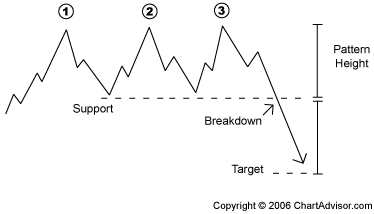 |
| Triple Top Pattern Three equal peaks amid a series of troughs. |
Purchase When:
• The price falls below the support that formed from the prior troughs.
Watch For:
• A series of three peaks at relatively the same level.
Set Your Target Price:
For triple top patterns, buy shares at a target price of:
• Entry price minus the pattern’s height (distance from the support to the top of the highest peak).
Now You Know…
The five most profitable stock patterns:
• symmetrical triangle
• ascending and descending triangles
• head and shoulders
• double top and double bottom
• triple top and triple bottom


