Saturday 27 February, 2010
Tuesday 16 February, 2010
WOLFE WAVE - An Outlook
Ans. Simply put, the Wolfe Wave is a natural rhythm that exists in all markets. It is made up of waves of supply and demand that form their own equilibrium.The key to its accuracy is in properly identifying the 1, 2, 3, 4 & 5 points. These are what give it its proper balance of equilibrium. It is very important to identify the dominant Wave. It is somewhat like recognizing those 3-D pictures. After a while a smile comes to your face and you say: "WOW, I see it."
Q. How to find them these points?
Ans. There are rules for every point in both bullish and bearish formations.
Rules for bullish formation .

1 .The 2 point is a top.
2.The 3 point is the bottom of the first decline.
3. The 1 point is the bottom prior to point 2 (top), that 3 has surpassed.
4. The 4 point is the top of the rally after point 3.
5. The 5 point is the bottom after point 4 and is likely to exceed the
ended trend line of 1 to 3. This is the entry point for a ride to the
EPAline (1 to 4).
6. Estimated Price at Arrival (EPA) is trend line of 1 to 4 at apex of
extended trend line of 1 to 3 and extended trend line of 2 to 4.
7. Estimated Time of Arrival (ETA) is apex of extended trend line of 1 to 3
and 2 to 4.
8. The Time take b/w point 1 to 3 should be equal to that of point 3 to 5.
Robin(Visit this link to know more about wolfe wave)
Saturday 6 February, 2010
How You Could Have Seen Imclone's Implosion Coming
Warning: This will be an "I told you so" column. We're going to look at a recent horror story and see why you should have bailed out by now. If it hits too close to home, you might want to move on and read something a little more pleasant. We're taking no prisoners today.
The RealMoney staff love to flutter their wings about the latest blowups. But I have a confession to make. I think the companies we chatter about are extremely boring.
Enron? That's an extinct bird, isn't it? And although I think Halliburton is a beautiful actress, she doesn't look that good in asbestos.
My problem with companies like Enron and Halliburton is they don't have four letters. After all, the Nasdaq is where I spend most of my time. It's also where other traders hang out, because of the direct-access systems. So how about a little more gossip about OTC bloopers, screwups and nose dives?
Momentum favorite ImClone Systems is a good place to start. It's fallen over 50% in the last three weeks and may not stop until it hits ground. In fact, every time knife-catchers step in to call a bottom, they wake up the next morning with long blades planted firmly in their backs.

It's easy enough to see where the five-month ImClone rally ended. After all, that's why they call it a broken trend line. Now this routine event isn't the end of the world. Broken rallies often lead to sideways markets, not death spirals. But sideways isn't nearly as good as up, so we'll mark the breakdown as Warning No. 1.

Warning No. 2 comes just two bars later, when the stock breaks the 50-day moving average on strong volume. Definitely not good news if you own the stock. In fact, it gives investors a very good reason to sell. The stock then waves another red flag. Price bounces back to the 50-day moving average from below but fails to break it for four sessions. Hear that ominous sound? Warning No. 3 just rang a very loud bell.

OK, this is getting serious. The selloff expands out of the failed test and closes at the low -- right at the 100% retracement of the last rally. This level should provide strong support and stop the selloff. So how come day-traders didn't step in and bounce the stock before the close? Members of the jury, I give you Warning No. 4.

Armageddon strikes the next day. Price rips a 19% gap on high volume and breaks the 200-day moving average. Enter Warnings No. 5 and No. 6. I wish that was the end of the story, but it isn't. While the gap does great technical damage on the daily chart, watch what happens when we zoom out and look at the long-term chart.

Warning No. 7 nails the coffin shut. The gap triggers the failure of a multiyear channel breakout. This opens the door for a trip all the way back to the lower $20s.
via-tradingday.com
Friday 5 February, 2010
Bilateral Trade Setups
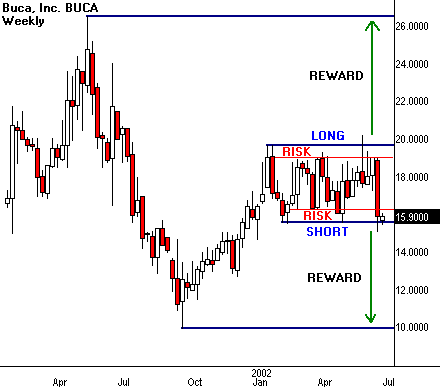
When it comes to trade setups, it's not always an either-or situation. In fact, you can double your fun with bilateral trade setups.
Start by overcoming directional bias when you look at a price pattern. Although you may see it in your mind as a long or a short, chances are it will work in either direction. The trick is to let the price action tell you which way to go.
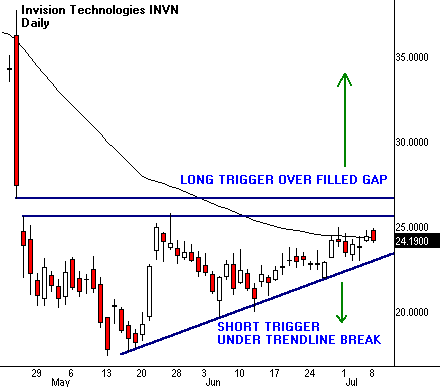
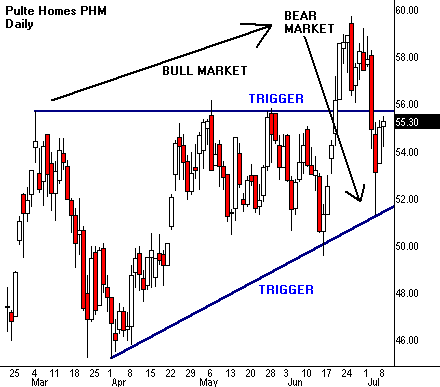
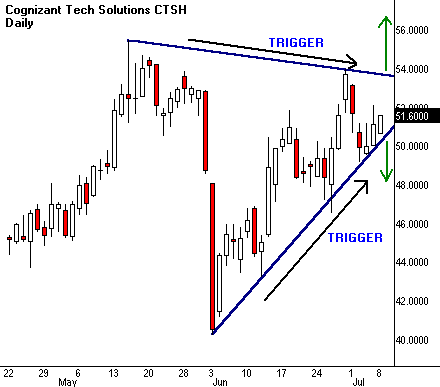
Let's back up a step and see how this works. Many patterns exhibit well-defined support and resistance. Bilateral setups use both levels for trade execution. A long entry is signaled if price breaks resistance to the upside. Conversely, a short sale is signaled if price breaks support to the downside. But you still have more work to do before taking a bilateral trade. After all, making money is the whole point of the exercise.

Every trade setup generates a unique reward/risk profile. In other words, it tells you how much you stand to win or lose should you decide to take a position. Each side of a bilateral setup carries a different reward/risk ratio. Most of the time, one side shows more profit potential than the other side. This can be frustrating because the calculation is independent of the odds that either outcome will actually take place. So you may have a great, high-odds setup with little or no reward, or a lousy, low-odds setup that would earn a fortune if it ever happens.

The price trigger complicates bilateral trade entry. Trading signals come in all varieties. The best ones ring very loud bells within very narrow price levels. One classic example is a high-volume breakout through a major moving average. Bilateral strategies force you to locate trigger prices on both sides of the pattern. Many times one side will bark much louder than the other when price hits the associated trigger.

Bilateral setups work best when they fit into larger cycles that encourage price movement in either direction. For example, a stock drops off a broad rally into an extended correction. Smaller patterns within this correction may trigger short-term rallies or selloffs. Bilateral strategy lets the trader take advantage of the mixed environment and execute price swings in both directions.
Let's review the signposts of this two-way trading street. We need well-defined support-resistance levels, a defined reward/risk ratio on both sides of the equation, clean price triggers and a big picture that lets us execute in either direction. Sounds simple enough, and it is.
The difficulty lies in our ability to control bias and to let the market tell us which way to go. Very often the best trade is in the opposite direction from the most obvious outcome for that pattern. In other words, the majority piles in one way, but the profit comes from trading it the other way.

The good news about these fascinating patterns is they may tell you when the move is about to happen. Congestion often narrows toward a trigger point. We see this in triangle patterns where two trendlines converge in price and time. Bilateral setups may show this convergence through simple lines, or sometimes through more complicated volatility cycles.
Volatility drops off through the formation of most bilateral patterns. It tends to reach a definable low, and then trigger a sharp price expansion. Traders examine narrow range price bars near support or resistance levels in order to predict impending price triggers. They also study classic volatility indicators to locate these turning points in developing patterns.
Swing traders go long or short, depending on the opportunity. Bilateral setups cut their workloads by presenting two possible trades in a single pattern. So always look at both sides of the equation when examining a price chart. Then leave your bias at the door, and take whatever the market gives you.


