This is default featured slide 1 title

Go to Blogger edit html and find these sentences.Now replace these sentences with your own descriptions.

This is default featured slide 2 title

Go to Blogger edit html and find these sentences.Now replace these sentences with your own descriptions.

This is default featured slide 3 title

Go to Blogger edit html and find these sentences.Now replace these sentences with your own descriptions.

This is default featured slide 4 title

Go to Blogger edit html and find these sentences.Now replace these sentences with your own descriptions.

This is default featured slide 5 title

Go to Blogger edit html and find these sentences.Now replace these sentences with your own descriptions.

Tuesday, 15 January 2013

Multibagger of Long Term Investing

Wouldn’t you be shocked if we told you that someone has turned Rs 10,000 into Rs 3,69,00,00,000 (Rs 369 Crores) in 32 years?. And that too by doing nothing in stock markets!! We bet you would be... :)


Your next question would definitely be – Who has done it?

Our answer is that we don’t know. But we are pretty sure that promoters of company would be one of them. They would have held shares for 32 years and made a killing. By the way, turning Rs 10K to Rs 369 Cr is same as growing your money 49% year on year for 32 consecutive years. Even great Warren Buffett managed a ‘paltry’ 25%...  So even if we told you earlier that you cannot become Warren Buffett, here we have data, which suggests that you actually can!!

(In comparison, banks pay 8% per year on deposits)

So now you’ll ask – How has it been done?

Before we answer this question, we would caution you that data given below has been collected from various sources and may or may not be correct. So, take it with a pinch of salt.

The company is WIPRO. Suppose you invested Rs 10,000 in its shares in 1980. You would have got 100 shares @ Rs 100 each. Now shares of Wipro have gone through multiple splits & bonuses. So we adjust them as and when splits & bonuses happened.

1980 – Bought 100 shares @ Rs 100

1981 – 1:1 Bonus = 200 shares

1985 – 1:1 Bonus = 400 shares

1986 - Stock Split to Rs.10 face value = 4000 shares

1987 - 1:1 Bonus = 8000 shares

1989 - 1:1 Bonus = 16,000 shares

1992 – 1:1 Bonus = 32,000 shares

1995 – 1:1 Bonus = 64,000 shares

1997 – 2:1 Bonus = 1,92,000 shares

1999 - Stock Split to Rs. 2 face value =9,60,000 shares

2004 – 2:1 Bonus =28,80,000 shares

2005 - 1:1 Bonus =57,60,000 shares

2010 – 3:2 Bonus =96,00,000 shares

Value of one Wipro share is around Rs.385.

So as of today, your investment of Rs 10k is worth a staggering  Rs.369 crores!!

And we are not finished yet. If you know about benefits of dividends, you would realize that Wipro has been a regular dividend payer. Last year it paid Rs 6 per share as dividend.  So you would have earned  Rs.5,76,00,000 (Rs 5.76 Crores) last year alone as dividend income. Just imagine how much you could have made from dividends alone in last 32 years. :-)

via - http://www.stableinvestor.com/2012/12/multibagger-of-long-term-investing.html

Friday, 11 January 2013

How stock scams works in India

I will teach you how stock scams work today and for that Let me declare something – “After years of study and hard work, I have come up with a strategy which can predict stock markets movement with almost 100% accuracy. Each month I can tell you which way market will move in next 30 days, it can be UP or DOWN and I can guarantee that. If someone needs to see the performance, I can give a free 6 tips trial.” Now what will be someone’s reaction on hearing this? Most probably, some of you will get excited and interested in getting these free tips, at least to check if I am saying truth or not! . Right now I have a big subscriber base with more than 10,000 people (11.5k to be precise) whom I can reach by email. Let’s see how I can create a stock tip scam -

Here is how we will build a scenario wherein you are Ajay who is extremely interested in knowing about the tops which are almost 100% accurate. Ajay is bearing some disbelief in his mind, but due to the trust factor in the given tips he thinks ‘Let’s see what tips Manish gives, they are free anyway and by reading his tips I am not losing anything’.

I start sending you exactly one tip each month and it starts this way:

Tip #1 (May) : Markets are headed UP

Reaction  : Markets really went UP in the month of May. Ajay feels good, but still he is confused if its just luck or did It really went up based on my tip . Ajay anyways wanted to just check the tip and how it turns out . He is a bit impressed and he has made up his mind to act upon the tips if 3 consecutive tips work.

Tip #2 (June) : Markets are headed UP

Reaction  : Markets after a bit of volatility finally went up and the tip was a success again! Markets are up by great extent, but Ajay feels like a fool to be so fearful and not act on it. But his confidence has started building up. If the next tip also works, Ajay will invest some money for sure based on the tip!

Tip #3 (July) : Markets are headed DOWN

Reaction : Crash! A huge sell off came in the month of July and the 3rd tip in a row was correct. Ajay starts feeling “Oh my god! Looks like Manish really have come up with something amazing which can predict markets” Ajay makes up his mind to “try” next 3 tips and see how it performs!

Tip #4 (Aug) : Markets are headed UP

Reaction : With all the excitement, Ajay has invested Rs 10,000 in the markets to see if he can make some quick bucks! However, Markets are headed down in the starting of the month and all the TV channels are confirming that next Crash is on the way. Ajay is a bit nervous and secretly praying for the tip to work somehow. He wants market to go UP as per the tip. Everybody around him has already sold off and decided to sell of all the stocks, but you are on the other side. You are praying, literally! And here it comes, markets make a turn up side and it makes one of the sharpest come back in 1 week. Ajay is now in profit and he feels like a winner. Ajay’s confidence in my tips is becoming stronger, but still he is not ready to take BIG risks, he needs to solid confirmation that the tips will fall true no matter what, which is about to come .He will invest 40k in the next tip of mine.

Tip #5 (Sept) : Markets are headed DOWN

Reaction :  Ajay thinks that he should liquidate all the investments in direct stocks and even his mutual funds. His friends do not think alike and suggest him that he should not go with the tip, but Ajay wants to confirm the tips and wants to see the affect on his investments in real time :) Markets move downside and he is now confirmed that there is really some kind of mega-research done by Manish to come up with the tips using his secret-strategy. Ajay can now visualize how he can become a millionaire soon by subscribing to the tips for next 1-2 yrs. He is just can’t wait for the last tip to show its magic!

Tip #6 (Oct) : Markets are headed DOWN

Reaction : Ajay is totally with the tips now and has decided to use this last one to make some quick bucks, he does some short selling and buys some puts options by finding out how to make money in falling markets. With his confidence in the free tips, he does not lose focus and waits for the tips to turn correct. Markets fall as per the tip and due to his decisions, Ajay has made some amazing money this time. He is clear that he wants these tips at any cost now!
Free tips are over now.

Taking money from the targets – How Stock Scams unfold

Tips are over now, Ajay and many others like Ajay has experienced the amazing tips which really worked. They all get a mail after few days from me.
Hi, you might have already got 6 free tips from me each month, we give only one tip each month, but it’s bound to work. It’s based on our strategy which is based on years of research. If you want to continue getting the tips further. It would cost Rs 50,000 for 1 year subscription. You can expect the same accuracy like you saw in last 6 months.

Disclaimer: The tips are highly accurate and we make sure they are accurate, but we can’t promise it and can’t guarantee it legally. Risk is yours
Ajay is so much impressed with my tips performance and so much drowned in greed, that he subscribes to my offer and pays 2 lacs for the secret tips subscription. The tips start coming from next month. But there is some issue this time! . Somehow, not all the tips are working this time. Some tips work, some does not. It’s not at all accurate like it was before. In reality all the tips are just random tips and Ajay is totally frustrated. He has lost a lot of money because he invested big money each time, thinking it would work!
The truth is Ajay fall prey to a stock scam. Now let me share how all this works.

How this scam works

At this moment I have around 10k or more email subscribers and I can send emails to this 10,000 group. I divide this group of 10,000 readers into 2 parts A and B, I send a tip “BUY” to A group and tip “SELL” to B group. One of them will be true for sure. After month is over, I see which tip was correct. If A group was correct, I discard group B and only have people in group A as my final group. This group will be the group which got “correct” tip.
Now I do the same thing again, I divide them in group A and B with 2,500 members each and send “BUY” and “SELL” tip to them. Now again, markets will move UP or DOWN and one of those groups will be right at the end of the month. I again discard the group which got wrong tip. This way I continue doing it for 6 times and at the end I have small group of 156 people who was right all the 6 times and Ajay accidently belonged to his group.
How Tip Scam works

Targets paying for the subscription

Now you can imagine how many people will fall prey to these scams? Even if 20% of the people fall in the trap and are ready to pay Rs 50,00o, it would be Rs 10 lacs in total! Here you can clearly see that out of 10,000 there will always be a group of 156 people who will always get “accurate” tips and the beauty of this strategy is that people who were discarded only get one wrong tip, and after that wrong tip, they don’t get any more tips.
There are many tip providers in real life who claim to give you 90-95% accurate tips with free 1 week trial, If you are getting a lot of right tips, you might be that lucky small group which is their “TARGET” as seen above in the chart. Don’t fall prey to these stock scams. Beware!

- by Manish Chauhan

Thursday, 10 January 2013

Sunday, 30 December 2012

Volume Spread Analysis - Ebook

Tuesday, 25 December 2012

2013 Market predictions


2012 is drawing to a close and Indian markets have given close to 25% returns this year. And just like past years, experts are coming out with targets like 21,000, 23,000 & 26,000 for Sensex. It seems that everyone is anticipating a bull market. And this anticipation is fueled by buzz words like Reforms, FDI, coming rate cuts, rising investor sentiments, etc.
So what are our predictions?


Before you close this website after reading our answers, we would like to tell you 2 things:

If a bull market is really coming, you will not listen to what we have to say. If markets correct next year, you will repent not listening to what we had to say.

So here is our answer:

We have decided not to make any predictions. It is irrelevant for long term investors like us. We will continue to invest in great companies and try buying them at really cheap prices.

So, have you decided to leave? Because you didn’t get that hot stock tip??

No?? …Then we will go ahead and tell you two really important facts…

Fact 1:

Indian markets are currently (December 2012) trading at P/E multiples of 19. And this is not cheap by any standards. You can check State of the Markets to get a snapshot of Indian market’s valuations. We have an analysis which tells that investing at current levels may not turn out to be a good bet for next 3-5 years. Anything less than 3 years does not interest us. Just check the table below:

PE Ratio & Returns Sensex
P/E Ratio of Sensex & 3-5 Year Returns

We are trading close to P/E multiple of 20. And average returns over 3 year periods are abysmally low at 4%. We won’t vouch for 5 year data as this number is skewed because of bull-run of 2002-07 (which may not be repeated during our lifetimes).

Fact 2:

We checked last 20 years’ data and found that 13 of those years gave positive returns. Out of these, 6 can be attributed to Great Indian Bull Run (2002-07). So, there were 7 ‘normal’ years of positive returns. These 7 years were followed by 4 years of negative returns & 3 years of positive returns. Surprised? Yes… its true. The probability of getting positive returns, just after an year of positive return is lower than that of getting negative returns.


We are sorry to disappoint those who were looking for hot stock tips for 2013. We continue looking for safe, stable, rock solid, cash generating machines. We don't know what would happen in 2013. But we do know what we would do in either cases. If markets correct, we would buy more of these great stocks. If it moves up into the overvaluation zone, we would not buy. It is as simple as that. :-) But as it has been rightly said, successful investing is simple, but not easy.

Saturday, 15 December 2012

Trading is a Journey in Self-Discovery

I know a trader, let’s call him Leon. He day trades Futures. He has been actively trading for several years. His profits are erratic and undependable, often going dramatically up and down in the same session. When Leon is making money his confidence soars and he feels like he is a power trader. On the other hand, when he loses money, which is more times than he cares to admit, he feels like a failure, a loser and stupid. For quite some time Leon has wondered why he can’t be consistently successful, and why his drawdowns tend to be much larger than his profits. He wonders this even though he has no Business Trade Plan, doesn’t consistently document his trades and despite having numerous rules, tends to violate them regularly. Leon doesn’t have a clue and wonders why he can’t get different results even though he continues with this pattern of behavior. Leon is out of control and unless he changes he is headed for a financial ice-cold shower. Are you Leon? 

 If you want to change your behavior, you must first change your thinking and since much of your thinking is driven by your unconscious, you must become aware of your underlying self-sabotaging beliefs that drive thinking, emotions and behavior. Trading is arguably the most difficult business venture on the planet; why? Because we are talking about money, and with every tick while in a trade you are either gaining or losing money. But, it goes beyond that. Money is not only the cornerstone of our society, it is tied up in your identity. If you are winning it, you often feel powerful, competent, intelligent or “good looking” and if you are losing you feel impotent, incompetent, stupid or “ugly.” The fact of the matter is that when you go to the market you invariably are expressing yourself; whether you want to, try to or feel a need to, it doesn’t matter, you are and will express yourself. And, when expressing yourself your behavior is tied much of the time to unconscious beliefs. Actually, when you are in the markets, every blemish, weakness and character flaw in your personality will be challenged, called out and tested. Now, that doesn’t mean that the markets are doing that to you. On the contrary, the markets have no intention for you – even though you may have often wondered how the markets knew that you just placed a long trade and how they chose that exact moment to reverse! Also, there are no rewards, punishments, pain or risk in the markets, only consequences. You provide all the rest. And, with changing yourself, you must provide all the ingredients for that as well. 


You can’t change what you can’t face and you can’t face what you don’t know. Awareness is key. The more aware you are of your underlying self-sabotaging beliefs the more you can position yourself to begin to address these issues – one at a time. Now, you might be asking; how do I do that? How do I become more aware if these limiting beliefs are unconscious. Good question! You become aware by simply asking questions of yourself, and by introspection and more importantly by personal observation as you are going through market observation. By checking yourself and checking the market you’ll begin to gain an awareness of why you have no Business Trade Plan or failing to follow the one you have. Why you have no Trade Journal, or failing to document in it. Why you are continuing to do things that you say you must stop doing; and why you are failing to do those very things that you say you must do. Once you identify the underlying self-sabotaging data, you can begin to deal with them…one issue at a time. 

 So, trading is a journey in self-discovery, and you must begin to pull back the layers of your unconscious onion, one at a time to begin to realize and recognize what is motivating you to behavior that is producing results that you don’t want. There are essentially two kinds of data with respect to trading. Many traders miss this fact and therefore miss a very important set of variables that impact heavily upon their trading. One type of data is mechanical data, which are everything that have to do with the markets; that being, news, technical analysis, instruments, indicators, etc.. This data is external to you. The next type of data is internal data, which are everything that have to do with your thoughts, emotions and behavior; in other words the T+E+B=R equation which impacts upon every outcome that you get. You must manage this equation in order to manage your results. 

 Trading is a 100% mental and emotional game. Either you are preparing, analyzing, processing or executing while trading; all of which require mental and emotional tools. If you don’t have mental and emotional tools that’s like driving without a steering wheel; and you will not only lose your way but you will crash and burn without it. And, you can’t steer if you are driving blindfolded. You must become aware of what is between you and keeping commitments with consistent follow-through. In Mastering the Mental Game we teach you tools and techniques to put the steering into your trading while helping you to remove the blindfolds as well in order for your journey to be a joyful and self-fulfilling one. Remember, you can’t change what you can’t face, and you can’t face what you don’t know. 

 May all your trades be green.

- Dr. M. Woodruff Johnson

(Dr Woody Johnson can be contacted at The Online Trading Academy)

Sunday, 25 November 2012

Wyckoff Spring Setup

Tuesday, 18 September 2012

Size dose matter!....in Stock Investing Too...


One size doesn’t fit all! And this is especially true in the case of stock investing too. Companies of all sizes are listed on the bourses. But no two people can create the same portfolio out of these companies. This is because each person has a different risk profile. And each company carries a different degree of risk. The size of the company is determined by its market capitalisation. The market capitalisation of the company is determined by calculating the per share price by the number of outstanding shares. Simply defined, it is how much you would pay to buy every share of stock on the market. Based on market cap, these companies are broadly classified into three different groups: Large cap, Mid cap and Small cap. To know in detail about market capitalization and its different groups,
You need to invest your money in the stock market based on your risk appetite and your return expectations, thus choosing stocks from amongst these different market caps.
For example, large cap stocks are considered to be relatively safe stocks. These companies have been around for a while, are stable and generally have a great track record to boast of. So if you are one those who cannot afford to risk losing any money, you need to stay invested in only the large cap stocks. If the water is choppy, would you like to be in a large boat or a small boat?
But their large size also means they probably won’t grow at a very high rate. . Does this mean that you cannot make high returns by investing in them? Definitely not! For profiting from investing in large caps you just need to pick up the right one at the right price and time!
In case you are looking for companies with higher growth and have the heart to take up a little risk, then mid cap stocks are the thing for you! However, you should be careful while investing in these. While the group can boast of quality stocks that went on to become the future large caps, it is also stained with history of stocks that have gone down the drain. In times of volatility, mid-caps are the first to be affected. These stocks are the first to be picked up when markets show signs of recovery and the first to be dumped on hints of an impending fall. And so you, Mr Investor, need to be extra careful while investing in these companies. Be sure to pick up fundamentally sound companies with a good future.
Finally, for the adventurous and aggressive ones, the market has what it calls the small cap stocks. While small caps are extremely volatile and ripe with history of companies going bankrupt; there have been some that have managed to sail right to the large caps and made investors millionaires. However, the risk that comes along with these stocks is extremely high. And while you need to be careful before investing in midcaps, you need to be doubly so before investing in a small cap.The question that you should answer is whether you should go fishing for stocks in a pool i.e. only large caps or an ocean i.e. across various market caps.
Large cap stocks form a large part of holding for Institutional investors, like pension funds, insurance companies and similar organizations, as they give the much needed stability to your portfolio. They are like the main course of your investment meal. Of course the dessert (small caps) is tastier and exciting, but without the main course, you cannot have a balanced and fulfilling meal! So, irrespective of your investment objective, large caps should form a large part of your portfolio. In fact, if your appetite for risk is nil or very low, your portfolio should just consist of just these mighty large caps.
But if your appetite for risk is a little high, you can invest in the mid cap stocks, provided they are fundamentally sound companies and are available at the right price.
Further, small-caps provide a terrific opportunity for sharp growth, so you might also want to invest a portion of your money in these stocks. But you need to be sure that you have the stomach to bear the high risk that these stocks entail. Most importantly, make sure you research them before jumping in.

Friday, 31 August 2012

Price Action Trading Method


Swing Highs and Lows
The first thing that we need to recognise is what is a Swing High and Swing Low. This is probably the easiest part of price action and bar counting although the whole process gets easier with practice.

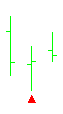
I define a swing high as;
Swing High     A three bar combination
     A bar preceded and succeeded by lower highs


I define a swing low as;
Swing Low     A three bar combination
     A bar preceded and succeeded by higher lows


Market Phases
There are only three ways the market can go;
  • Up
  • Down
  • Sideways
With the swing high/low definition now in mind we can start to build some layers on to the chart to identify these market phases and start to do a simple count of these swing highs and lows.
In short
  • The market is going up when price is making higher highs and higher lows
  • The market is going down when price is making lower highs and lower lows
  • The market is going sideways when price is not making higher highs and higher lows OR lower highs lower lows
This may sound like child's play and a statement of the obvious but you will be surprised at how often people will forget these simple facts. One of the biggest questions I get asked is, which way is the market going? By doing a simple exercise you can see which way that price is going and decide on your trading plan and more importantly timing of a trade.
What do I mean by timing? It may be that you are looking for a shorting opportunity as the overall trend is down but price on your entry time frame is still going up (making HH's & HL's). There is, at this stage, no point in trying to short a rising market until price action start to point down (making LH's & LL's. More on this shortly).
Bias Changes
Bias Change
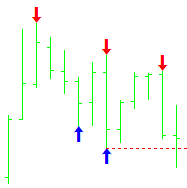
A Short or Bearish Bias Change occurs when the following sequence develops.
HH>HL>LH>LL>LH The bias change is confirmed when price moves below the las lower low made as highlighted on the chart.
Another way of saying this is 123 reversal and you are trading the pullback as your entry trigger (Red Line).
There are a few variations of this pattern but this is quite simply a price action bias change in its simplest form.
Bias Change
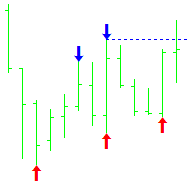
A Long or Bullish Bias Change occurs when the following sequence develops.
LL>LH>HL>HH>HL The bias change is confirmed when price moves above the last higher high made as highlighted on the chart.
Another way of saying this is 123 reversal and you are trading the pullback as your entry trigger (Blue Line).
There are a few variations of this pattern but this is quite simply a price action bias change in its simplest form.
Trending Price Action
After a bias change has been seen and confirmed, one of the phases that the market can then take is to start trending either up or down depending on the bias change previously.
In the chart below we can see what price ideally looks like when price is trending up and trending down. Each phase shows price making HH's & HL's on its way up and LH's & LL's on its way down.
Trending upTrending Down
Ranging Price action
Now this is where the chart can become interesting. By using the price action counting of the swing highs and lows we can know at a very early stage IFprice is going to start to develop range bound activity.
  • Price is not making new highs OR new lows
I don't mean all time highs/lows or new day/week/month highs/lows... just simply a new chart swing high or low. Price will start to stall and not make a new swing high/low and typically will stay contained within the last swing high and low that was made on the chart. Isn't that a simple definition?
Range rule definitions
  • Price doesn't make a new high or low on the move
  • If price stays contained within the last swing high and swing low to be made, price will remain range bound until it makes news move highs or lows.
  • Price confirms the range when a lower high and a higher low is made within the previous swing high and low.
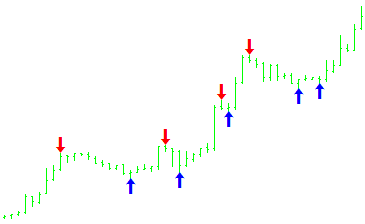
In the chart below you can see that from the left side of the chart price is making LH's & LL's all the way to the first blue arrow which in real time would be the latest lowest low. Price then moves higher to make a HH. These two swing levels have been highlighted.
At the point of the chart, in real time, price needs to either start moving higher past the last swing high (red Arrow) making a new high OR move lower past the last swing low (blue arrow) making a new low. Until either of those things happens price will most likely remain range bound. In this example that is what happened.
Range Bound
Range considerations
Some considerations for identifying ranges at an early stage in real time are;
  • That price could be creating a pullback or bias change and as the chart unfolds for you a new high or low could be made voiding the potential range.
  • There are several definitions of a range one of the more common ones is that you are looking for a double touch of support and resistance. For me this is a little too late in the game as price may not create the double touch as in the example above. With this price action method you can identify the possibility of a range developing VERY early without having to worry IF price does or does not give you the double touch. As you can see with that definition you would interpret that price is not range bound at all but, you can clearly see visually that price is moving sideways without any definition.
What you should have learnt from this short article
  • A simple rule defined method to identify swing highs and lows
  • How to use this swing high/low definition to interpret price action market phases
  • How to identify a bias change
  • How to identify trending price action
  • How to identify Range bound price action
Bias Change pattern variation
In the below images we can see the pattern variation and compare them to the outlined pattern above.  The only main difference is that you are looking for a breach of a previous swing high or low as the first qualifier to indicate a potential bias change.

Bias Change Variations

Acronyms used
  • HH - Higher High
  • HL - Higher Low
  • LH - Lower High
  • LL - Lower Low
By Philip Newton
www.trading-strategies.info

Philip Newton is a professional trader and teaches new and experienced traders the skills needed to trade for a living. His live chat room is amongst the best in the industry. Inside the members area traders can watch videos of his trades and receive support for any question they may have. The live trading room is the heart of the website where the real learning begins. www.trading-strategies.info

PRICE & VOLUME RELATIONSHIP


PRICE & VOLUME RELATIONSHIP


Up-trending marketPriceVolume
   
UptrendUpUp
CorrectionDownDown
ReversalDownUp

Down-trending marketPriceVolume
   
UptrendDownUp
CorrectionUpDown
ReversalUpUp

Market directionPriceVolumeCalculation
    
UptrendUpUp+ Volume
DowntrendDownUp- Volume
CorrectionsUp / DownDown0