This is default featured slide 1 title

Go to Blogger edit html and find these sentences.Now replace these sentences with your own descriptions.

This is default featured slide 2 title

Go to Blogger edit html and find these sentences.Now replace these sentences with your own descriptions.

This is default featured slide 3 title

Go to Blogger edit html and find these sentences.Now replace these sentences with your own descriptions.

This is default featured slide 4 title

Go to Blogger edit html and find these sentences.Now replace these sentences with your own descriptions.

This is default featured slide 5 title

Go to Blogger edit html and find these sentences.Now replace these sentences with your own descriptions.

Saturday, 28 November 2009

Moving Average Crossovers

Let's talk about the Golden Cross and the Death Cross. No, we're not opening a deck of cards and telling your fortune. These colorful terms refer to patterns you probably use every day in your trading but don't refer to by these names. Along with its many cousins, they comprise a whole division of technical analysis. You might know them better as moving average crossovers.

Moving averages emit vital market data, but all of them exhibit one common limitation: They lag current events. By the time a 20-bar average curves upward to confirm a trend, the move is already underway and may even be over. While faster incarnations (such as exponential averages) will speed up signals, all of them ring the trading bell way too late.
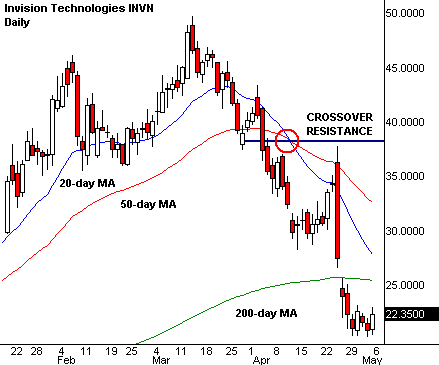
Multiple moving averages overcome many flaws of the single variety. They're especially powerful when used in conjunction with price patterns. For example, pick out a long-term and a short-term average. Then watch price action when the averages turn toward each other and cross over. This event may trigger a good trading signal, especially when it converges with a key support or resistance level.

Averages display all the common characteristics of support/resistance. For example, one average will often bounce off another one on a first test, rather than break through right away. Then, like price bars, the odds shift toward a violation and crossover on the next test. Alternatively, when one average can't break through another average after several tries, it sets off a strong trend-reversal signal.

Different holding periods respond to different average settings. One-to-three-day swing trades work well with averages that maintain a 3x to 4x relationship between shorter and longer periods. This allows convergence/divergence between different trends to work in the trader's favor.

For example, the daily chart may show a strong uptrend, while the 60-minute chart begins a deep pullback. A 40-day average will stay pointed in the trend direction for a long time, but a 13-day average (3x13=39) will turn down quickly, and head straight for the longer average. The point where they intersect represents a major support level.
Crossovers mark important shifts in momentum and support/resistance regardless of holding period. Many traders can therefore just stick with the major averages and find out most of what they need to know. The most popular settings draw charts with a 20-day for the short-term trend, a 50-day for the intermediate trend and a 200-day for the big picture.

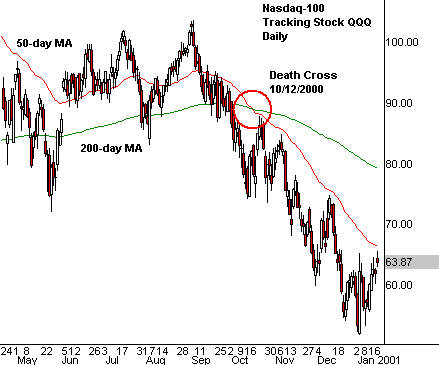
Long-term crossovers carry more weight than short-term events. The Golden Cross represents a major shift from the bears to the bulls. It triggers when the 50-day average breaks above the 200-day average. Conversely, the Death Cross restores bear power when the 50-day falls back beneath the 200-day. The 200-day average becomes major resistance after the 50-day average drops below it, and major support after breaking above it. When price gets trapped between the 50-day and 200-day averages, it can whipsaw repeatedly between their price extremes. This pinball action marks a zone of opportunity for swing trades.
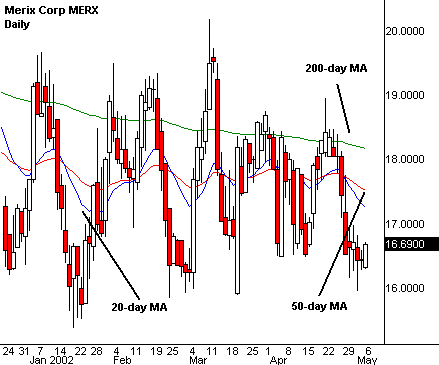
Crossovers add horsepower to many types of trading strategies. But try to limit their use to trending markets. Moving averages emit false signals during the "negative feedback" of sideways markets. Keep in mind these common indicators measure directional momentum. They lose power in markets with little or no price change.

For years, technicians have tried to filter crossover systems through trend-recognition formulas in order to reduce whipsaws. You can try this for yourself, or just look for price patterns that tell you the crossovers are worthless.

Persistent rangebound markets limit the usefulness of all types of average information. All moving averages eventually converge toward a single price level in dead markets. This flatline behavior yields few clues about market direction. So stop using averages completely when this happens, and move to oscillators (such as Stochastics) to predict the next move.
Five Fibonacci Tricks

Fibonacci jumped into the technical mainstream late in the bull market. Futures traders had it all to themselves until real-time software ported it over to the equity markets. Its popularity exploded as retail traders experimented with its arcane math and discovered its many virtues.

Fibonacci ratios describe the interaction between trend and countertrend markets -- 38%, 50% and 62% retracements form the primary pullback levels. Apply these percentages after a trend in either direction to predict the extent of the countertrend swing. Stretch a grid over the most obvious up or down wave, and see how percentages cross key price levels.

Convergence between pattern and retracement can point to excellent trading opportunities. Keep in mind that retracements work poorly in a vacuum. Always examine highs, lows and moving averages to confirm the importance of a specific level.

Discord between retracement and the underlying pattern generates noise instead of profit. Move on to a new chart when nothing lines up correctly. This divergence generates most of the whipsaw in a price chart. Alternatively, strong phasing between Fibonacci and pattern exposes highly predictive reversals at narrow price levels.

Let's look at five tricks to improve your Fibonacci skills. Add these twists and turns to your toolbox and apply them to your next trade. I promise they'll serve you very well in the years ahead.


First Rise/First Failure

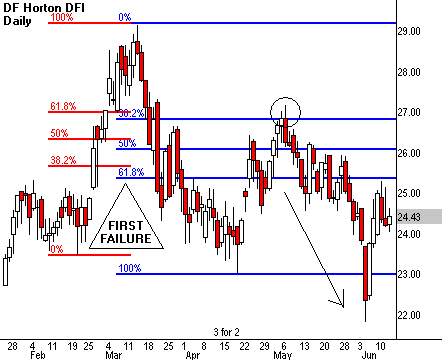
First Rise/First Failure marks the first 100% retracement of a trend within your time frame of interest. It provides an early reversal warning after a new high or low. The 100% retracement violates the major price direction and terminates the trend it corrects. From this level, the old trend can reestablish itself if it breaks through the old 38% level. More often, traders will use that level to enter low-risk positions against the old trend.


Parabola Hunt

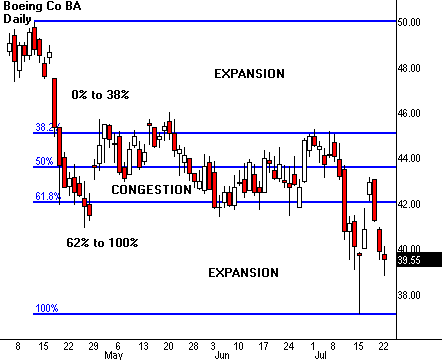
Parabolic movement tends to occur between the 0%-to-38% and 62%-to-100% Fibonacci levels in all trends. This tendency offers a great tool for finding the big moves when looking for trades. Watch for congestion to form at the 38% or 62% level. Then use a simple breakout or breakdown strategy when price moves past it. The next thrust can be dramatic, with price moving like a magnet back to an old high or low. Of course, the strategy only works when you can find these levels in advance.


Continuation Gap Extensions

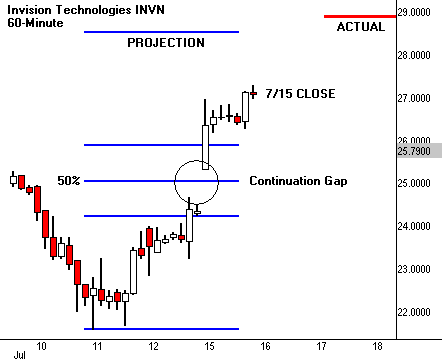
You can often target the exact price a rally or selloff will end at by using the continuation gap as a Fibonacci extension tool. Identify the gap by its location at the dead center of a vertical price wave. Then start a Fib grid at the beginning of the trend and extend it so the gap sits under the 50% retracement level. The grid extension points to the terminating price for the rally or selloff.


Overnight Grids

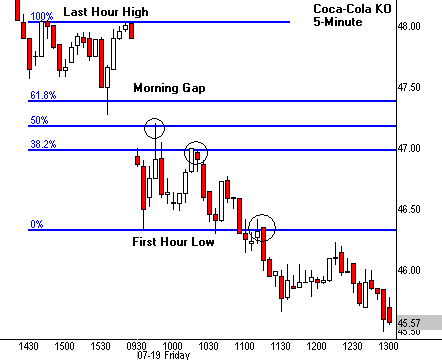
Find an active stock and start a grid from the high (or low) of a session's last hour. Stretch the grid to the opposite end of the next morning's first hour low (or high). This defines a specific price wave traders can use to uncover intraday reversals, breakouts and breakdowns. The overnight grid also offers a way to trade morning gaps. The gap will often stretch across a key retracement level and target low-risk entry on a pullback.


Second High/Low

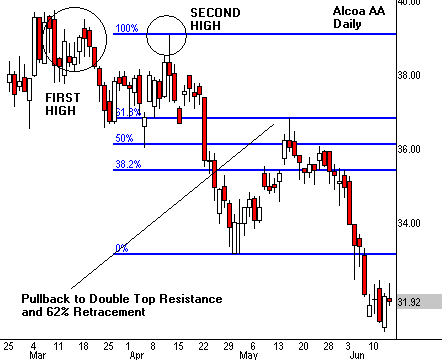
Many traders can't figure out where to start a Fib grid. Here's a trick to help you place it where it'll do the most good. The absolute high or low in a price wave isn't the best starting point for a grid most of the time. Instead, look for a small double bottom or double top within the congestion where the trend began. Swing one end of the grid over this second high (or low), instead of the first. This will capture a specific Elliott Wave that conforms to the trend you're trying to trade.


Sunday, 1 November 2009

Fibonacci

Thursday, 29 October 2009

Options

Options

Welcome to the mysmp.com options trading education center. Now, more than ever, is an extremely important time for traders to learn what option trading is all about and also to understand how they can use options to help control risk during times of heightened volatility. While many traders use option contracts to help mitigate risk, others will use them to speculate on volatility and direction. Whatever type of trader you may be, it is important to understand your risk profile and investment objectives before selecting a strategy.

For the newbie’s to option trading, you can get started with a quick primer on calls and puts with our stock options introduction article above. Here you will be given an overview of calls & puts and also be provided with descriptions of the various components which go into the pricing of an option such as expiration date, strike price and moneyness. Be sure to review our glossary to get a more detailed explanation on these subjects.

Above, you will find options strategies for every type of investor and every type of market. You will find a broad array of strategies that can be used in bull markets, bear markets, or flat markets. For example, bull call spreads can be used in bull markets to take advantage of upward prices while bear put spreads can do the same in bear markets. In those times where there is no volatility at all, you want to be short options to take advantage of their time decay; the short straddle is a great example of this. Be sure to understand the potential risk and reward scenario as well as the breakeven points before establishing a position. Remember, a net buyer of options (debit spread) will have a defined risk while a net seller (credit spread) will have an unlimited risk profile.

Take your time and learn how to trade these option strategies at your own pace. It is advisable to start with the more basic strategies which only consist of a single leg such as the covered call, married put, naked put, or synthetic call. Once you have these strategies mastered, you can move on to double leg strategies such as the straddle and strangle. For the more advanced options traders, triple and quadruple leg option strategies may be reviewed such as the butterfly and condor spreads.


via - http://www.mysmp.com/options.html

Friday, 16 October 2009

Welcome to PANGUVANIHAN

Dear friends,

Welcome to Panguvanihan. Panguvanihan..that is Stock Trader, is a new addition in line with my existing Tamil Blog http://panguvaniham.wordpress.com/ and English blog http://paisapower.blogspot.com/ . Panguvaniham closely follows the daily market movement in which I try to give my views in easy Tamil, whereas Paisapower is purely an educational platform for both the traders and investors.

From today...here in Panguvanihan I will be sharing my views and ideas about potential scripes, which is meant for short term and long term investment. All the suggestions given in this blog are purely for educational purpose and hence you are requested to do your own analysis, homework before taking any trade decisions.

I Wish you good luck and Happy trading.

-Saravanakumar

Thursday, 15 October 2009

How is the SENSEX Calculated !

For the premier Bombay Stock Exchange that pioneered the stock broking activity in India, 128 years of experience seems to be a proud milestone. A lot has changed since 1875 when 318 persons became members of what today is called The Stock Exchange, Mumbai by paying a princely amount of Re 1.

Since then, the country’s capital markets have passed through both good and bad periods. The journey in the 20th century has not been an easy one. Till the decade of eighties, there was no scale to measure the ups and downs in the Indian stock market. The Stock Exchange, Mumbai in 1986 came out with a stock index that subsequently became the barometer of the Indian stock market.

Sensex is not only scientifically designed but also based on globally accepted construction and review methodology. First compiled in 1986, Sensex is a basket of 30 constituent stocks representing a sample of large, liquid and representative companies.

The base year of Sensex is 1978-79 and the base value is 100. The index is widely reported in both domestic and international markets through print as well as electronic media.

The Index was initially calculated based on the “Full Market Capitalization” methodology but was shifted to the free-float methodology with effect from September 1, 2003. The “Free-float Market Capitalization” methodology of index construction is regarded as an industry best practice globally. All major index providers like MSCI, FTSE, STOXX, S&P and Dow Jones use the Free-float methodology.

Due to is wide acceptance amongst the Indian investors; Sensex is regarded to be the pulse of the Indian stock market. As the oldest index in the country, it provides the time series data over a fairly long period of time (From 1979 onwards). Small wonder, the Sensex has over the years become one of the most prominent brands in the country.

The growth of equity markets in India has been phenomenal in the decade gone by. Right from early nineties the stock market witnessed heightened activity in terms of various bull and bear runs. The Sensex captured all these events in the most judicial manner. One can identify the booms and busts of the Indian stock market through Sensex.

Sensex Calculation Methodology

Sensex is calculated using the “Free-float Market Capitalization” methodology. As per this methodology, the level of index at any point of time reflects the Free-float market value of 30 component stocks relative to a base period. The market capitalization of a company is determined by multiplying the price of its stock by the number of shares issued by the company. This market capitalization is further multiplied by the free-float factor to determine the free-float market capitalization.

The base period of Sensex is 1978-79 and the base value is 100 index points. This is often indicated by the notation 1978-79=100. The calculation of Sensex involves dividing the Free-float market capitalization of 30 companies in the Index by a number called the Index Divisor.

The Divisor is the only link to the original base period value of the Sensex. It keeps the Index comparable over time and is the adjustment point for all Index adjustments arising out of corporate actions, replacement of scrips etc. During market hours, prices of the index scrips, at which latest trades are executed, are used by the trading system to calculate Sensex every 15 seconds and disseminated in real time.

Dollex-30

BSE also calculates a dollar-linked version of Sensex and historical values of this index are available since its inception.

Understanding Free-float Methodology

Free-float Methodology refers to an index construction methodology that takes into consideration only the free-float market capitalisation of a company for the purpose of index calculation and assigning weight to stocks in Index. Free-float market capitalization is defined as that proportion of total shares issued by the company that are readily available for trading in the market.

It generally excludes promoters’ holding, government holding, strategic holding and other locked-in shares that will not come to the market for trading in the normal course. In other words, the market capitalization of each company in a Free-float index is reduced to the extent of its readily available shares in the market.

In India, BSE pioneered the concept of Free-float by launching BSE TECk in July 2001 and Bankex in June 2003. While BSE TECk Index is a TMT benchmark, Bankex is positioned as a benchmark for the banking sector stocks. Sensex becomes the third index in India to be based on the globally accepted Free-float Methodology.

Friday, 9 October 2009

Measuring Reward: Risk

Why do great trade setups fail, while lousy ones move in our favor? The answer is quite simple, yet frustrating. Trading is an odds game, in which anything can happen at any time. Price will go where price wants to go, no matter how hard we hit the books, study the charts or pray to the deities. So rather than searching for the perfect trade, we're better off learning to control risk first.

You've forgotten the nature of risk if you can answer "yes" to any of the following questions. Do you still buy "how-to" books, even though you've traded for years? Do you sit in bad losses because you hate to be wrong? Do you reject market wisdom because you lost money trading it?

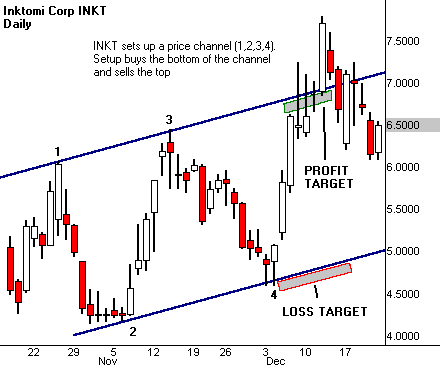
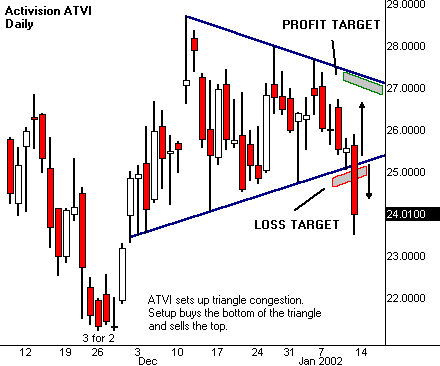
Measure reward:risk before taking a trade, and let it guide your open position. Price close to good support identifies a low-risk long setup. Price close to substantial resistance identifies a low-risk short sale. The distance between your trade entry and the next obstacle within your holding period measures the reward, and intended exit. The distance between the entry and the price that breaks the trade points to the risk, and unintended exit. Put the odds firmly in your favor by only taking trades with high reward, and low risk.

The best swing trades exit in wild times, just as advancing price approaches a strong barrier. Reward planning seeks discovery of this price before trade entry. This profit target sits at a level where risk will increase dramatically when price reaches it. Traders should exit immediately once this profit target is struck, or at least place a stop that locks in profit, in case of a reversal.

Every setup has a price that busts the trade. The safest trades need only a small move to signal a bad outcome, and the need to jump ship. This loss target changes dynamically after entry. Consider the impact of the last price bar on evolving reward:risk, and adjust the plan accordingly. Many traders find it difficult to absorb new information quickly. So they're better off sticking with the original plan, and using trailing stops to protect the position.

How do you know the price that kills the trade? You'll find it at the convergence of support-resistance boundaries on your setup. These usually turn up through combinations of violated moving averages, broken patterns and filled gaps. Every situation is different, so finding the loss target may require all of your trading skills.

Exit swing trades to book profits, take losses or close mediocre positions. A good exit is more valuable than a great entry. Emotions usually run high at both reward and risk targets. So take a deep breath and clear the mind before closing out a position.

Tips on Reward:Risk Management

- Watch the clock and become a market survivor. Market cycles affect price movement in many ways.

- Exploit market quirks in your entries and exits. Events like overnight gaps and options expiration can benefit positions, rather than hurt them.

- Enter smaller trades when signals don't line up well.
Good timing on bad stocks makes more money than bad timing on good stocks.

- The best signals converge through many different types of technical analysis.

- Use common sense and good mathematics in your profit and loss projections.

- The most profitable entries and exits come when the crowd is leaning the wrong way.


via - www.tradingday.com

Monday, 7 September 2009

Learn from your mistakes to master the art of investing

The Thirukkural is an ancient non-religious literature that guides people on better living. Though written over 2,000 years ago by Thiruvalluvar in Tamil, the way of life advised by Thirukkural is still relevant today.

This article is an attempt to bring the wealth of knowledge embedded in Thirukkural about finance; accessible to everyone. Thirukkural is composed of 1,330 kurals in 133 sections of ten each.

A Kural is a couplet and each Kural is composed of 7 words spread across 2 lines [4 + 3 words]. The work on wisdom is divided into three major chapters - those that speak about Virtue, Wealth and Love.

Kural 411 says "Chelvathul chelvam sevichchelvam; achchelvam Chelvathul ellem thalai"

The translation of the Kural goes like - "The best wealth among wealths is that got by listening; this wealth is the leader of all wealths."

Learning from experience, may many times prove to be very costly in terms of the time, emotions and cost involved in the learning. So it is better if we could learn form the others too. Among the many ways to leverage learning of others including proper education, reading, listening is said to be best by Thiruvalluvar.

The philosophical meaning

The meaning of this Kural in a philosophical sense is that, one should not depend only on the material wealth. The wealth of knowledge got by listening to others' experiences will be ours for ever; whether we have material wealth or not. That way the wisdom that we have received is indestructible and hence is the best wealth one could get.

Role of listening in investing

Active listening is said to be one of the best ways to be a good communicator. It is also one of the best ways to make good investment decisions. Robert G Allen author of 'Nothing Down' a book that talks about acquiring real estate without putting any of our own money as down payment, talks of one of his ways to buy a property.

The rule is 100-20-10-1. The rule in detail goes like this, when we want to buy a property, we need to visit and see 100 properties; take quotes from 20 of those properties; enter into negotiation for 10 of those properties; ultimately buy one.

Effect of leveraging listening

The effect to our wisdom related to buying property is that, by listening to 100 people talking about their properties, we get to know how property is valued. What could be problems in managing those? Which type of neighbors is better for us? Are we paying for the built-up area or the living area?

How good is the ground water, sun shine, noise, dust, etc? Will the walls bear the effect of banging long nails or drilling needed for putting the wiring? Is the government having any plans for acquisition in that area? Is the new electric crematorium planned for the area next our apartment? Does the cat in the opposite house love to measure the length of roots in potted plants (We have 25 highly valued Bonsais)?; so on and so forth.

If we had not done the 100 to 1 act of painstaking listening, we may be a victim and may have to endure a period of life-long education on how not to buy a house. How many people have we seen buying a house just because some relative or colleague said the property has 'good value'? Are they all happy?

Leverage wisdom before investing in stocks

We have a lot of people giving us tips for investing in the stock market. Some of them are from good intensions of friends, relatives and colleagues. Some of them are from our brokers and some from professional paid tips providers. The leveraging of listening to gain wisdom applies also to the stock market.

The way to learn and to some times pull the tipster himself/herself from trouble is to ask the question-WHY? If the answer is that some one reliable said so and that is WHY? Probably the reason for the buy or sell is already past its time. So please do not do anything.

If however the suggestion to buy or sell is substantiated by a set of reasons, there may be some substance for buying. But again we need to do our own reasoning and searching to make the decision to buy or sell a stock.

Skepticism vs listening

The above argument is not to be skeptical to whatever the other person says. Rather it is not to be carried away by what ever others say. The active listening way to creating wealth is to be empathetic to the other person's words and derive knowledge. This wealth of wisdom that we get from others becomes ours and no one can take it away from us - come what may.

Kural 421 says: "Arivuatram kakkum karuvi cheruvarkku Ulazhikkal aha aran"

It means "For the king (head of the family, manager) wisdom acts as a tool for protection and also as wealth that the enemy cannot destroy". Listen better so you can learn better. Learn better so you can invest better.


Source:
BankBazaar.com is an online marketplace where you can instantly get loan rate quotes, compare and apply online for your personal loan, home loan and credit card needs from India's leading banks and NBFCs.
Copyright 2009 www.BankBazaar.com. All rights reserved

Saturday, 5 September 2009

Which Time Frame is better ?

Time Frame Breakdowns

Which one is better?

It depends on your personality!

Let me give you a breakdown of the three to help you choose:

Time frame
Description
Advantages
Disadvantages
Long-term

Long-term traders will usually refer to daily and weekly charts. The weekly charts will establish the longer term perspective and assist in placing entries in the shorter term daily. Trades usually from a few weeks to many months, sometimes years.

Don’t have to watch markets intraday

Fewer transactions means less paying of spreads

Large swings which require large stops

Usually 1 or 2 good trades a year so patience is required

Bigger account needed to ride longer term swings

Frequent losing months

Short-term

Short-term traders use hourly time frames and hold trades for several hours to a week.

More opportunities for trades

Less chance of losing months

Less reliance on one or two trades a year to make money

Transaction costs will be higher (more spreads to pay)

Overnight risk becomes a factor

Intraday

Intraday traders use minute charts such as 1-minute or 5-minute.

Trades are held intraday and exited by market close.

Lots of trading opportunities

Less chance of losing months

No overnight risk

Transaction costs will be much higher (more spreads to pay)

Mentally more difficult due to frequency of trading

Profits are limited by needing to exit at the end of the day.

You have to decide what the correct time frame is for YOU.