This is default featured slide 1 title

Go to Blogger edit html and find these sentences.Now replace these sentences with your own descriptions.

This is default featured slide 2 title

Go to Blogger edit html and find these sentences.Now replace these sentences with your own descriptions.

This is default featured slide 3 title

Go to Blogger edit html and find these sentences.Now replace these sentences with your own descriptions.

This is default featured slide 4 title

Go to Blogger edit html and find these sentences.Now replace these sentences with your own descriptions.

This is default featured slide 5 title

Go to Blogger edit html and find these sentences.Now replace these sentences with your own descriptions.

Monday, 7 September 2009

Learn from your mistakes to master the art of investing

The Thirukkural is an ancient non-religious literature that guides people on better living. Though written over 2,000 years ago by Thiruvalluvar in Tamil, the way of life advised by Thirukkural is still relevant today.

This article is an attempt to bring the wealth of knowledge embedded in Thirukkural about finance; accessible to everyone. Thirukkural is composed of 1,330 kurals in 133 sections of ten each.

A Kural is a couplet and each Kural is composed of 7 words spread across 2 lines [4 + 3 words]. The work on wisdom is divided into three major chapters - those that speak about Virtue, Wealth and Love.

Kural 411 says "Chelvathul chelvam sevichchelvam; achchelvam Chelvathul ellem thalai"

The translation of the Kural goes like - "The best wealth among wealths is that got by listening; this wealth is the leader of all wealths."

Learning from experience, may many times prove to be very costly in terms of the time, emotions and cost involved in the learning. So it is better if we could learn form the others too. Among the many ways to leverage learning of others including proper education, reading, listening is said to be best by Thiruvalluvar.

The philosophical meaning

The meaning of this Kural in a philosophical sense is that, one should not depend only on the material wealth. The wealth of knowledge got by listening to others' experiences will be ours for ever; whether we have material wealth or not. That way the wisdom that we have received is indestructible and hence is the best wealth one could get.

Role of listening in investing

Active listening is said to be one of the best ways to be a good communicator. It is also one of the best ways to make good investment decisions. Robert G Allen author of 'Nothing Down' a book that talks about acquiring real estate without putting any of our own money as down payment, talks of one of his ways to buy a property.

The rule is 100-20-10-1. The rule in detail goes like this, when we want to buy a property, we need to visit and see 100 properties; take quotes from 20 of those properties; enter into negotiation for 10 of those properties; ultimately buy one.

Effect of leveraging listening

The effect to our wisdom related to buying property is that, by listening to 100 people talking about their properties, we get to know how property is valued. What could be problems in managing those? Which type of neighbors is better for us? Are we paying for the built-up area or the living area?

How good is the ground water, sun shine, noise, dust, etc? Will the walls bear the effect of banging long nails or drilling needed for putting the wiring? Is the government having any plans for acquisition in that area? Is the new electric crematorium planned for the area next our apartment? Does the cat in the opposite house love to measure the length of roots in potted plants (We have 25 highly valued Bonsais)?; so on and so forth.

If we had not done the 100 to 1 act of painstaking listening, we may be a victim and may have to endure a period of life-long education on how not to buy a house. How many people have we seen buying a house just because some relative or colleague said the property has 'good value'? Are they all happy?

Leverage wisdom before investing in stocks

We have a lot of people giving us tips for investing in the stock market. Some of them are from good intensions of friends, relatives and colleagues. Some of them are from our brokers and some from professional paid tips providers. The leveraging of listening to gain wisdom applies also to the stock market.

The way to learn and to some times pull the tipster himself/herself from trouble is to ask the question-WHY? If the answer is that some one reliable said so and that is WHY? Probably the reason for the buy or sell is already past its time. So please do not do anything.

If however the suggestion to buy or sell is substantiated by a set of reasons, there may be some substance for buying. But again we need to do our own reasoning and searching to make the decision to buy or sell a stock.

Skepticism vs listening

The above argument is not to be skeptical to whatever the other person says. Rather it is not to be carried away by what ever others say. The active listening way to creating wealth is to be empathetic to the other person's words and derive knowledge. This wealth of wisdom that we get from others becomes ours and no one can take it away from us - come what may.

Kural 421 says: "Arivuatram kakkum karuvi cheruvarkku Ulazhikkal aha aran"

It means "For the king (head of the family, manager) wisdom acts as a tool for protection and also as wealth that the enemy cannot destroy". Listen better so you can learn better. Learn better so you can invest better.


Source:

BankBazaar.com is an online marketplace where you can instantly get loan rate quotes, compare and apply online for your personal loan, home loan and credit card needs from India's leading banks and NBFCs.
Copyright 2009 www.BankBazaar.com. All rights reserved
Saturday, 5 September 2009

Which Time Frame is better ?

Time Frame Breakdowns

Which one is better?

It depends on your personality!

Let me give you a breakdown of the three to help you choose:

Time frame
Description
Advantages
Disadvantages
Long-term

Long-term traders will usually refer to daily and weekly charts. The weekly charts will establish the longer term perspective and assist in placing entries in the shorter term daily. Trades usually from a few weeks to many months, sometimes years.

Don’t have to watch markets intraday

Fewer transactions means less paying of spreads

Large swings which require large stops

Usually 1 or 2 good trades a year so patience is required

Bigger account needed to ride longer term swings

Frequent losing months

Short-term

Short-term traders use hourly time frames and hold trades for several hours to a week.

More opportunities for trades

Less chance of losing months

Less reliance on one or two trades a year to make money

Transaction costs will be higher (more spreads to pay)

Overnight risk becomes a factor

Intraday

Intraday traders use minute charts such as 1-minute or 5-minute.

Trades are held intraday and exited by market close.

Lots of trading opportunities

Less chance of losing months

No overnight risk

Transaction costs will be much higher (more spreads to pay)

Mentally more difficult due to frequency of trading

Profits are limited by needing to exit at the end of the day.

You have to decide what the correct time frame is for YOU.

Monday, 31 August 2009

MACD - An overview

15 WAYS TO TRADE MOVING AVERAGES

Reading a chart without moving averages is like baking a cake without Butter or eggs. Those simple lines above or below current price tell Many tales and their uses in market interpretation are unparalleled.

Simply stated, they're the most valuable indicators in technical Analysis.

You can trade without moving averages, but you do so at your own risk.

After all, these lines represent median levels where your competition Will make important buying or selling decisions. So it makes sense to Predict what they're going to do before the fact, rather than afterward.

Here are 15 ways you can manage opportunity through moving

Averages:

1. The 20-day moving average commonly marks the short-term trend, The 50-day moving average the intermediate trend, and the 200-day Moving average the long-term trend of the market.

2. These three settings represent natural boundaries for price

Pullbacks. Two forces empower those averages: First, they define Levels where profit- and loss-taking should ebb following strong price Movement. Second, their common recognition draws a crowd that Perpetrates a self-fulfilling event whenever price approaches.

3. Moving averages generate false signals during range-bound markets Because they're trend-following indicators that measure upward or Downward momentum. They lose their power in any environment that Shows a slow rate of price change.

4. The characteristic of moving averages changes as they flatten and Roll over. The turn of an average toward horizontal signifies a loss of Momentum for that time frame. This increase the odds that price will Cross the average with relative ease. When a set of averages flat line And draw close to one another, price often swivels back and forth Across the axis in a noisy pattern.

5. Moving averages emit continuous signals because they're plotted Right on top of price. Their relative correlation with price development Changes with each bar. They also exhibit active convergence divergence Relationships with all other forms of support and resistance.

6. Use exponential moving averages, or EMAs, for longer time frames But shift down to simple moving averages, or SMAs, for shorter ones.

EMAs apply more weight to recent price change, while SMAs view each Data point equally.

7. Short-term SMAs let traders spy on other market participants. The Public uses simple moving average settings because they don't Understand EMAs. Good intraday signals rely more on how the Competition thinks than the technicals of the moment.

8. Place five-, eight- and 13-bar SMAs on intraday charts to measure Short-term trend strength. In strong moves, the averages will line up And point in the same direction. But they flip over one at a time at highs And lows, until price finally surges through in the other direction.

9. Price location in relation to the 200-day moving average determines Long-term investor psychology. Bulls live above the 200-day moving Average, while bears live below it. Sellers eat up rallies below this line In the sand, while buyers come to the rescue above it.

10. When the 50-day moving average pierces the 200-day moving Average in either direction, it predicts a substantial shift in buying and Selling behavior. The 50-day moving average rising above the 200-day Moving average is called a Golden Cross, while the bearish piercing is Called a Death Cross.

11. It's harder for price to break above a declining moving average than A rising moving average. Conversely, it's harder for price to drop Through a rising moving average than a declining moving average.

12. Moving averages set to different time frames reveal trend velocity Through their relationships with each other. Measure this with a classic Moving Average-Convergence-Divergence (MACD) indicator, or apply Multiple averages to your charts and watch how they spread or contract Over different time.

13. Place a 60-day volume moving average across green and red

Volume histograms in the lower chart pane to identify when specific Sessions draw unexpected interest. The slope of the average also Identifies hidden buying and selling pressure.

14. Don't use long-term moving averages to make short-term

Predictions because they force important data to lag current events. A Trend may already be mature and nearing its end by the time a specific Moving average issues a buy or sell signal.

15. Support and resistance mechanics develop between moving

Averages as they flip and roll. Look for one average to bounce on the Other average, rather than break through it immediately. After a Crossover finally takes place, that level becomes support or resistance For future price movement

Monday, 24 August 2009

Investing in an IPO? Read this!

Here is a simplified idea of how to analyse initial public offerings (IPOs) using technical and fundamental analysis.

There have been raging discussions during the past three years, both, when the Indian IPO market was booming and when it was crashing.

Should we invest in IPOs or rather buy the stock when it comes to the secondary market? The debate over this a long-drawn one with varying answers during boom and bust.

This article will try to give some tools and ratios, which help us decide whether to invest in an IPO or not at any time!

Analysis based on market value (market cap)

Market value in the case of an IPO can be defined as the number of shares available for subscription multiplied by the price per share plus the price per share multiplied by outstanding shares if any.

In the case of analysis, when there is a price band available, it's advisable to do the analysis based on the lowest price.

Check 1: Price to Sales (P/S) ratio

This number is derived by dividing the market value by the value of annualised sales. It can also be derived by dividing the price of a share by the sales per share. It is basically an indication of the amount the company is trying to garner from the market vis-a-vis its current business.

A rule of thumb for the P/S ratio when deciding on IPO investment is that lower the P/S ratio the better it is as an investment.

A word of caution is that it should not be the only parameter before deciding.

Check 2: Price to Earnings (or Loss) P/E ratio

This number is derived by dividing the market value by the annualised profits (loss) for the company. It is an indicator of the number of multiples that the market is ready to pay for the stock over its current profit levels.

If the profit is Rs 2,500 crore (Rs 25 billion) and number of equity shares is 1,000, then the P/E is 2.5. Meaning, the market is ready to pay 2.5 times the profit per share to buy the stock.

Thumb Rule for P/E with respect to IPOs

The lower the P/E, the better it is for the investor. In simple terms, a lower P/E means, you are getting to buy something that has the ability to reap high benefits at a very cheap price.

The irony is that during boom times uninformed investors get carried away by high P/E multiples.

Check 3: Price to Book value (P/B) ratio

The book value is defined as the difference between total assets and liabilities. In a more crude way, it is also defined as the amount that will be left back after paying all liabilities in case of a closure.

The P/B of an IPO is calculated as market value divided by the book value. It gives an idea on what value the market places on the stock based on its books.

Thumb rule: Lower the P/B the better. It would be advisable for a potential IPO investor to look for IPOs with low P/B. Some of these stocks are called value stocks.

Long-term investors buy such companies and hold on to them till they slowly but steadily grow their business till a day when the share prices might shoot up phenomenally and then exit with huge profits.

Check 4: Price to Tangible Book Value (PTBV) ratio

This number is derived by dividing the market value by the tangible book value. The Tangible Book Value (TBV) is equal to the book value of the company minus the intangible assets.

Intangible assets are those that cannot be seen or felt. Examples include IP rights, goodwill patents, etc. Similar to P/B, it can also be crudely seen as the amount an investor would get if the company ceases to exist and all its assets have to be sold.

The reason it is seen separately is that most intangible assets would be very difficult to sell in case of closure.

Thumb rule: Lower the PBTV the better. A PBTV of 0-1.0 (zero to one) means the company is trading at or below the worth of its own tangible assets. Once the mark crosses one, the risk for the investor too is proportionally higher.

In case of certain companies the PBTV could be negative too.

Check 5: Gross margin percentage

The gross margin percentage is derived by dividing the gross margin of the company (the margin before accounting for taxes, depreciation, expenses, etc) by the total value of sales. This gives an idea of what is the percentage of margins for any value of sales.

Thumb rule: Higher the gross margin the better. This in simple terms indicates that the company's product of service has a good margin of income. The higher the gross margin, the better would be the actual profit. For certain industries where costs are very high the gross margin percentage would be low.

In such cases, we need to analyse if it's higher than for other competitors in the same domain of business.

Check 6: Profit margin percentage

This number is derived by dividing the profits by total value of sales. Again, as in the case of gross margin percentage, higher the profit margin percentage, the better it would be to invest in the IPO of that company.

A word of caution, though. The gross profit margin percentage and the profit margin percentage should be analysed for at least 3-4 years to check for consistency.

Some companies might show higher margins due to one off reasons which might not hold true after the IPO.

All the above calculations need to be taken into consideration along with the analysis of the company's management, its business model, the sustainability of its product/service and other such fundamental parameters while deciding to invest in an IPO or not.

Source: BankBazaar.com is an online marketplace where you can instantly get loan rate quotes, compare and apply online for your personal loan, home loan and credit card needs from India's leading banks and NBFCs.Copyright 2009 www.BankBazaar.com. All rights reserved

Saturday, 22 August 2009

Is the stock market a gambling arena?

Many people shy away from the stock market thinking it is a lot like gambling and some even think it is gambling. The vagaries of the stock market in the form of sudden spurts and dizzying falls only add fuel to this thought.

Adding fuel to the aversion is the past pain from few experiments -- many in their 40s are still not entering the market because they were hurt by the Harshad Mehta scandal!

Short-term trading versus Investing
The goals for any investor in the stock market change very dramatically based on whether he is a short-term player or a long-term one. In the short term, the market has to be perform the role of an income generator for the trader/investor. In the long term, it has to give capital appreciation for the investor.

The first thing to remember is that when we buy a stock (a share in any company), we get a part ownership in the company. We have a right to a part of the assets and a part of the profits that the company generates.

The price of the share will be reflected by the current and future profits of the company and also by the various forces that affect the business of the company. There are several macro-level factors such as the political, social, and international environment too that affect the business and hence the share prices.

Shares are best for the long-term investor
To generate income out of shares is possible in two ways:
Wait for the dividend. This income is going to be quite low compared to the market price of the share. Typical Indian dividend yield (dividend per share/market price of share) is in the range of 1% to 2%. Not quite attractive.

The other way is to generate trading gains. This is highly risk laden as inherently share prices follow randomness. The Random Walk Theory says that the events in the past do not affect the price of the shares in the future. Hence, it is not possible to predict the future price of shares. This means that to generate income by trading one has to speculate. That is gambling.
In the long run (three years and above), however, the scenario is different. There is sufficient control for the management of the company to steer it to success or failure. And this will be reflected in the stock market as rise or fall in the share prices.

As an investor in the company, we too get signs on whether to hold on to the share or to let it go. In the short run companies can fool its investors by changing some numbers and by making good presentations but in the long run to compete and to grow, they have to deliver value.

Returns in the long run
The stock market remains the undisputed and consistent leader for returns in the long run. In spite of the economy slowing down in India and going into a depression in many parts of the world, the historical Sensex returns are still very attractive.

The Sensex was formed as an index to reflect the stock market movements in the year 1979. The value at that time started at 100. On August 14, 2009 this figure stood at 15,400. This translates to a compounded annual growth rate of an amazing but true 18.28%.

We cannot see any other asset class giving such returns over the long term. Is there a reason why stocks perform so well in the long run? Yes, there are.

As business people, the promoters of the companies have an inherent reason for working towards the growth of their companies. Also businesses need time to grow and flourish.
As businesses compete with each other during their growth, they come out with creative, efficient and effective solutions to our needs and problems. This creates value for us as consumers and as investors. The country itself grows because of this.

Case in proof
A case in proof is a Bangalore family that was surprised by the value of shares that their late father had accumulated. He had bought shares of Hindustan Level Limited (HLL -- now Hindustan Unilever Ltd) consistently for over 20 years from whatever savings he could scrap from his earnings as an executive in a private company.

At one point in time HLL was the largest company in India and he loved the company. Post his retirement he continued to hold the shares in the material form itself. After he passed away, the family found that he had over Rs 1 crore (Rs 10 million) worth of HLL shares!

Stock market is not a gambling arena
The stock market is a tool for investing and wealth-creation. As discussed above it is a way to create wealth in the long term. It should not be mixed with gambling nor should it be used for that purpose.

Like gambling, it might be thrilling in the short term but too much indulgence in thrill at the expense of strong fundamentals could lead to major losses.

Ironically, the media and the people around us always highlight the extremities rather than focus on the fundamentals. For example, a person losing Rs 500,000 in one day is given more importance than someone earning the same amount in three years. This has been the major cause of creating a negative picture of the stock markets.

We need to come out this imagery and look at the broader and long-term picture. Long-term investors can never lose money in the stock market if the fundamentals are right!

BankBazaar.com
Source: BankBazaar.com is an online marketplace where you can instantly get loan rate quotes, compare and apply online for your personal loan, home loan and credit card needs from India's leading banks and NBFCs.Copyright 2009 www.BankBazaar.com. All rights reserved
Friday, 24 July 2009

What Are The Different Types Of Technical Indicators?

If you open up any charting package and attempt to put some form of technical indicator alongside the price, you will usually be presented with endless different technical indicators to assist you with your trading.

This can be slightly overwhelming when you first start using technical analysis, because you don't know which indicators are best, what information they are conveying, or how to interpret the data. So in today's article I'm going to briefly discuss the different types of technical indicators available to you.

There are basically four different types of technical indicators:

1. Trend indicators.

These indicators are used to indicate the direction of a trend. These are very useful because the basic rule is that you should always trade with a trend and not against it. Some examples of trend following indicators include Parabolic SAR, MACD and Moving Averages.

2. Momentum indicators.

Momentum or strength indicators are used to indicate the speed or strength of a move in price and are best used to determine a change in direction. They tend to be oscillating indicators showing overbought and oversold positions. Examples include CCI, RSI and Stochastics.

3. Volatility indicators.

These indicators, as the name suggests, show a change in volatility, which often leads to a change in price. Examples include ATR, Bollinger Bands and Envelopes.

4. Volume indicators.

Volume indicators are used to show the volume of trading in a particular currency. These are useful to confirm the direction of a trend or to signal a breakout. For example, if the pair trades in a narrow range and then breaks out on high volume, then this is a very bullish signal. Examples of volume indicators include Chaikin Money Flow, Demand Index and OBV.

The ideal charting set-up should have at least one indicator of each kind, but it's also important to remember that technical analysis is not foolproof. It's there to help you make trading decisions, but no indicator or set of indicators will give you a 100% success rate.

via - http://theforexarticles.com/

Sunday, 12 July 2009

The 3 Duck’s Trading System

Firstly I would like to say, I did not reinvent the wheel with this system, I have just added one or two ideas to a 60 period simple moving average (sma) to make it my own and named it “The 3 Duck’s Trading System” for obvious reasons as you will find out later on. The system is fairly straight forward and easy to use. Like a lot of trading systems it will be more productive when prices are moving in one direction and not stuck in a tight trading range. Of course this system has losing trade and losing runs, but with proper money management and good discipline I’m sure this system will keep you out of bad trades and give you a great chance to make profits in the Fx market. One of the nice things about this system is it will quickly tell you if prices are in an up or down swing phase and stop you from guessing! It will also allow you to decide to be a bull or a bear and trade in the direction of that trend. There are 3 charts involved in this system: a 4hr chart, a 1hr chart and a 5min chart. There is 1 indicator, a 60 period simple moving average (60 sma) plotted on each chart. There you go, its that simple.

How it works:

Step 1 - First Duck

The first thing we need to do is look at our largest time-frame (4hr chart) and see if current prices are above or below the 60 sma. From this chart we can see that current price is below the 60 sma. This tells us that we maybe looking to sell.

Step 2 - Second Duck

The second thing we need to do is drop down to our 1hr chart. We need to see the current price below the 60 sma on this chart also, this gives us confirmation. Important: If the current price was to be above the 60 sma on this chart we could not move on to step 3.

Step 3 - Third Duck

From step 1 and 2, current prices need to be below their 60 sma’s on each chart. We are now on the 5 min chart and we are looking to sell when price crosses below the 60 sma. For extra confirmation we should let prices break the last low on the 5 min chart. This would mean that prices will be below their 60 sma on all 3 time-frames, therefore all 3 Ducks are lined up in the same direction.

Stop-Losses: This is where you can make this system your own. If you are a short term trader you may want to put your stop-loss above the highs on the 5 min or the 1 hr chart. If you are more of a positional trader you may wish to put your stop-loss above a high on the 4 hr chart. You could also use a fixed stop-loss, maybe 25-30 pips or more from entry. It all depends what type of a trader you are, so you decide! If you are a longer term trader or investor, this system can help you get a good entry point into the market. Another “trick” that may help you preserve capital, If you do sell and prices get back above the 5 min 60 sma by 10 pips (not a good sign) you may want to cut your losses short before your stop-loss. But if you are a longer term trader this may not be a big deal for you.

Targets: Same again, depends what type of a trader you are but target can be support or resistance levels.

Summary: The above example was carried out when the gbp/usd was trading lower so obviously we where selling - the system works just as well for buying opportunities, just look for prices to be above the 60 sma on all 3 time-frames, starting with step 1 again. I like this system a lot as it does not try to out-guess the markets movements and pick tops and bottoms. The system will quickly tell you to be a buyer or a seller. Its a good honest system that tries to follow prices. This system works better on currency pairs such as the Eur/Usd and Gbp/Usd, but there is nothing stopping you from plotting this system on any pair, but as we know some pairs act differently to others. The best time I found for trading this system is the European and US sessions. I lke to use this system as a guide in addition to my own market knowledge. Take care to watch what is going on around you - economic new releases, holidays etc.

Good Luck with the 3 Duck’s Trading System.

Captain Currency.

Wednesday, 11 March 2009

Five Chart Patterns You Need to Know

Five Chart Patterns You Need to Know

In the report you'll learn how to:

  • Recognize profitable stock patterns
  • Minimize your investment risk in three simple steps
  • Lock in high returns by choosing the right selling price
  • Maximize your profits even when the market is down

Profitable Pattern Number One
The Symmetrical Triangle: A Reliable Workhorse


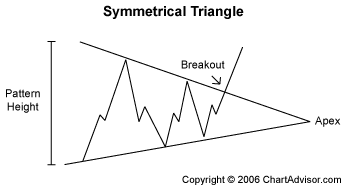
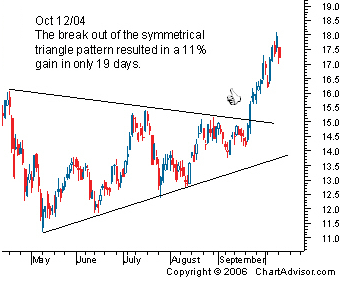
You’ll recognize the symmetrical triangle pattern when you see a stock’s price vacillating up and down and converging towards a single point. Its back and forth oscillations will become smaller and smaller until the stock reaches a critical price, breaks out of the pattern, and moves drastically up or down.


The symmetrical triangle pattern is formed when investors are unsure of a stock’s value. Once the pattern is broken, investors jump on the bandwagon, shooting the stock price north or south.

Symmetrical Triangle Pattern
To form your symmetrical triangle pattern, draw two converging trendlines that bound the high and low prices. Your trendlines should form (you guessed it) a symmetrical triangle, lying on its side.


How to Profit from Symmetrical Triangles

Symmetrical triangles are very reliable. You can profit from upwards or downwards breakouts. You’ll learn more about how to earn from downtrends when we talk about maximizing profits.


If you see a symmetrical triangle forming, watch it closely. The sooner you catch the breakout, the more money you stand to make.


Watch For:

• Sideways movement, a period of rest, before the breakout.
• Price of the asset traveling between two converging trendlines.
• Breakout ¾ of the way to the apex.

Set Your Target Price:

As with all patterns, knowing when to get out is as important as knowing when to get in. Your target price is the safest time to sell, even if it looks like the trend may be continuing.

For symmetrical triangles, sell your stock at a target price of:

• Entry price plus the pattern’s height for an upward breakout.
• Entry price minus the pattern’s height for a downward breakout.


Profitable Pattern Number Two
Ascending and Descending Triangles: The Traditional Bull and Bear


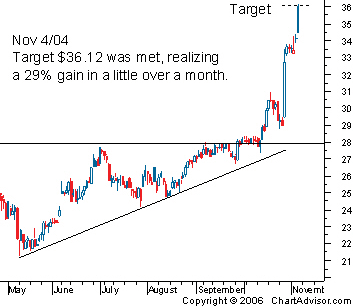
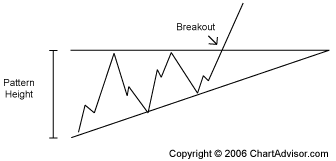
When you notice a stock has a series of increasing troughs and the price is unable to break through a price barrier, chances are you are witnessing the birth of an ascending triangle pattern.

Ascending Triangle Pattern
Confirm your ascending triangle pattern by drawing a horizontal line tracing the upper price barrier and a diagonal line tracing the series of ascending troughs.


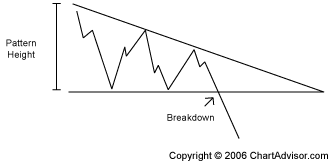
The descending triangle is the bearish counterpart to the ascending triangle.

Descending Triangle Pattern
Confirm your descending triangle by drawing a horizontal line tracing the lower price barrier and a diagonal line tracing the series of descending troughs.


The ascending and descending patterns indicate a stock is increasing or decreasing in demand. The stock meets a level of support or resistance (the horizontal trendline) several times before breaking out and continuing in the direction of the developing up or down pattern.


How to Profit from Ascending and Descending Triangles


Ascending and descending triangles are short-term investor favorites, because the trends allow short-term traders to earn from the same sharp price increase that long-term investors have been waiting for. Rather than holding on to a stock for months or years before you finally see a big payday, you can buy and hold for only a period of days and reap in the same monster returns as the long-time stock owners.


As with many of our favorite patterns, when you learn to identify ascending and descending triangles, you can profit from upwards or downwards breakouts. That way, you’ll earn a healthy profit regardless of where the market is going.


Watch For:

• An ascending or descending pattern forming over three to four weeks.


Set Your Target Price:

For ascending and descending triangles, sell your stock at a target price of:

• Entry price plus the pattern’s height for an upward breakout.
• Entry price minus the pattern’s height for a downward breakout.


Profitable Pattern Number Three
Head and Shoulders: A ChartAdvisor Staple


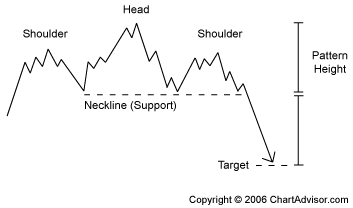
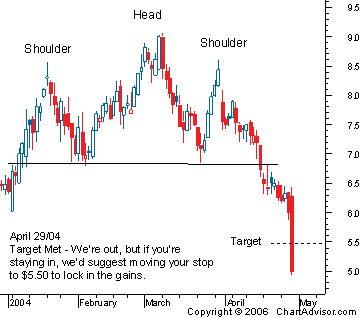
The head and shoulders pattern is a prevailing pattern among short sellers, investors who profit from downtrends. After three peaks, the stock plummets, offering a textbook, high-return opportunity to traders who catch the trend early.

Head and Shoulders Pattern
Head and shoulder patterns are characterized by a large peak bordered on either side by two smaller peaks. Draw one trendline, called the neckline, connecting the bottom of the two troughs.

The first trough is a signal that buying demand is starting to weaken. Investors who believe the stock is undervalued respond with a buying frenzy, followed by a flood of selling when traders fear the stock has run too high. This decline is followed by another buying streak which fizzles out early. Finally, the stock declines to its true worth below the original price.


How to Profit from the Head and Shoulders Pattern

• Short sell as soon as the price moves below the neckline after the descent from the right shoulder.


Set Your Target Price:

For the head and shoulders pattern, buy shares at a target price of:

• Entry price minus the pattern’s height (distance from the top of the head to the neckline).


Profitable Patterns Number Four and Five
Triple and Double Bottoms and Tops: Reversals upon reversals


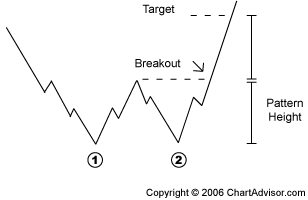
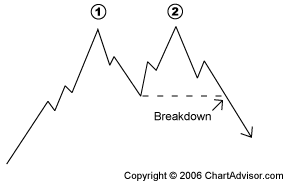
When you see a W or M pattern forming, you may have just discovered a money-making double bottom or double top pattern. These patterns are common reversal patterns used to suggest the current stock trend may be likely to shift.


But don’t panic if your double bottom or double top patterns do not develop as you had originally thought. You haven’t lost your chance for cash. If your W or M pattern reverses for a fourth time, you could now be working with the profitable triple bottom or triple top.


Double Bottom Pattern

Double Bottom Pattern
A small peak is surrounded by two equal troughs.

Purchase When:

• The price exceeds the middle-peak price.

Watch For:

• A price increase of 10% to 20% from the first trough to the middle peak.
• Two equal lows, not to differ by more than 3% or 4%.

Set Your Target Price:

For the double bottom pattern, sell your stock at a target price of:

• Entry price plus the pattern’s height (distance from the peak to the bottom of the lowest trough).


Double Top Pattern

Double Top Pattern
A small trough is surrounded by two equal peaks.

Short Sell When:

• The price drops below the middle-trough price.

Watch For:

• A price decrease of 10% to 20% from the first peak to the middle trough.
• Two equal highs, not to differ by more than 3% or 4%.


Set Your Target Price:

For the double top pattern, buy shares at a target price of:

• Entry price minus the pattern’s height (distance from the trough to the top of the highest peak).


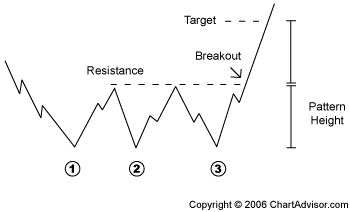
Triple Bottom Pattern

Triple Bottom Pattern
Three equal troughs amid a series of peaks.


Purchase When:

• The price exceeds the resistance established by the prior peaks.

Watch For:

• A series of three identical troughs at the end of a prolonged downtrend.


Set Your Target Price:

For triple bottom patterns, sell your stock at a target price of:

• Entry price plus the pattern’s height (distance from the resistance to the bottom of the lowest trough).


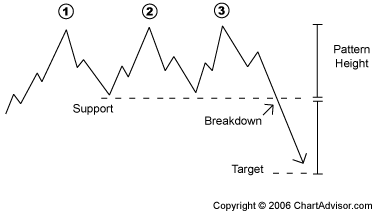
Triple Top Pattern

Triple Top Pattern
Three equal peaks amid a series of troughs.

Purchase When:

• The price falls below the support that formed from the prior troughs.


Watch For:

• A series of three peaks at relatively the same level.


Set Your Target Price:

For triple top patterns, buy shares at a target price of:

• Entry price minus the pattern’s height (distance from the support to the top of the highest peak).


Now You Know…

The five most profitable stock patterns:

• symmetrical triangle
• ascending and descending triangles
• head and shoulders
• double top and double bottom
• triple top and triple bottom

Donchian's Trading Method...

How simple! Richard Donchian used the 4 week rule. The Turtles used the same strategy in the eighties. Donchian's strategy was to "buy when a stock made a 4 week new high" and his exit rule was " sell when it makes a two week low" How simple things can be! But the very simplicity of this concept makes it difficult to understand for today's fast paced internet freak day traders who have no vision to look beyond a 24 hour life span, forget about four weeks! Pity! and in a way it is good because there would be less competition! Ignorance is bliss.


Article adapted from and written by The Indian Market Monitor