


A reader asked me to look at India’s Stock Exchange (”Nifty”) and I’m seeing an interesting potential Elliott Wave Count that may be setting up clearer than the S&P 500 Index. Let’s see the Weekly and Daily Structure.
India’s Stock Exchange (S&P CNX “Nifty” Index - $CNXN) Weekly:

I’m not an expert at India’s Stock Exchange, but let’s see what the charts might be hinting to us.
Clearly, we’re in a downtrend and the moving averages have just crossed into the most bearish orientation possible. Price is beneath all of them and we’re coming off a New Momentum Low that formed in October. Price retraced back to the falling 20 week EMA (fell just shy of it) and appears to be inflecting downward to make possible new lows. The entire bearish analysis will be invalidated if we get a move up here to close above 3,200, which would invalidate the Elliott Wave Count and also break above the falling 20 week EMA.
Speaking of Elliott Wave, the easiest count I have us here is in the final 5th Wave of the massive 3rd Wave Down. Officially, I have us ready to begin the third wave of the 5th wave. I’ve drawn a possible pathway price might take (which again will be invalidated with a close above 3,200).
Look closely at the Wave Count to see if you have a different interpretation you would like to share. I have the 3rd Wave Sub-dividing into its own large-scale 5 wave pattern, and if that is correct, then we’re missing the Final Fifth Wave to complete the pattern. Afterwards, we would expect a large-scale “ABC” circled 4th Wave (major) to take us back to 3,500 or perhaps 4,000.
Let’s drop to the Daily Chart to see this massive potential 3rd wave in action.
India’s Stock Exchange (S&P CNX “Nifty” Index - $CNXN) Daily:
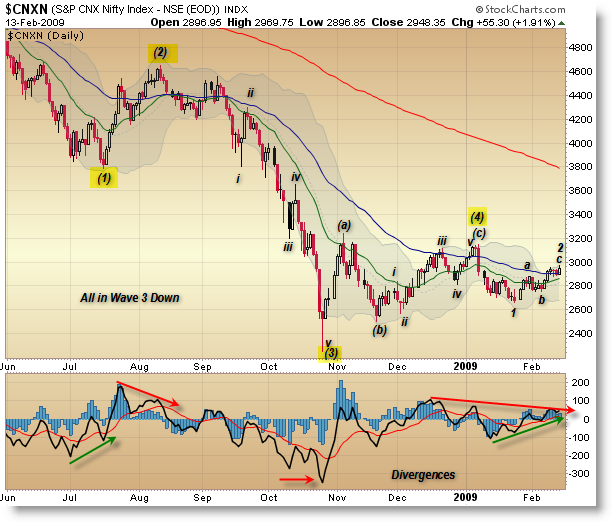
If you don’t understand Elliott Wave, side-step the numbering to look at the orientation of price to the key moving averages and what happened in the past when price formed Divergences (or other momentum readings).
I have the Corrective 4th Wave completing in January as price formed a “Bull Trap” (at the same time the S&P 500 did so) before price began its descent into February. Price has actually shown relative strength to the S&P 500. I have us forming a triangle on the momentum oscillator and - in terms of Elliott - completing the c Wave of 2 which means - if this is correct - then we’ll soon be breaking down from these levels.
One force counter-acting that currently is the EMA structure - which is actually in the most bearish orientation possible, though price is currently supporting above these averages. Watch this closely for additional clues.
A second way to interpret the Elliott Count would be to place the entire structure (after Wave 3) into an ABCDE Triangle, with the November high = A; Nov Low = B; January high = C; January Low = D; and current price = E. If this is the dominant count, then it would imply a downside break is imminent to plunge us into the first wave of the final 5-wave structure down. This also would be invalidated with a close above 3,200.
If you have further interest, watch this chart closely to see if we break to the upside… but if we break down from here, we’ll know the Elliott Count and resolution is the most likely outcome of the current structure, which would mean new lows will be realized likely in March. Same goes for the US S&P 500 as well.
-Corey Rosenbloom